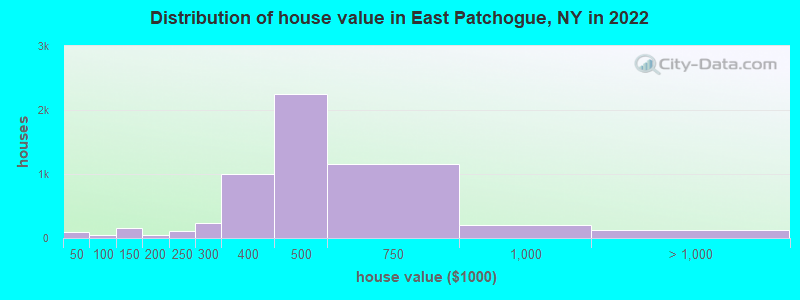
Estimated median house or condo value in 2023: $497,757 (it was $154,900 in 2000)
East Patchogue:
$497,757
NY:
$420,200
Mean prices in 2023:all housing units: $648,540; detached houses: $692,307; townhouses or other attached units: $520,335; in 2-unit structures: $570,396; in 3-to-4-unit structures: $435,817; in 5-or-more-unit structures: $404,988; mobile homes: $233,459; occupied boats, rvs, vans, etc.: over $1,000,000
Median gross rent in 2023: $1,739.
December 2024 cost of living index in East Patchogue: 148.4 (very high, U.S. average is 100)
Percentage of residents living in poverty in 2023: 6.5%
(6.6% for White Non-Hispanic residents, 6.3% for Black residents, 7.7% for Hispanic or Latino residents, 7.7% for other race residents, 3.8% for two or more races residents)
According to our research of New York and other state lists, there were 4 registered sex offenders living in East Patchogue, New York as of April 28, 2025. The ratio of all residents to sex offenders in East Patchogue is 5,660 to 1. The ratio of registered sex offenders to all residents in this city is much lower than the state average.
Recent articles from our blog. Our writers, many of them Ph.D. graduates or candidates, create easy-to-read articles on a wide variety of topics.
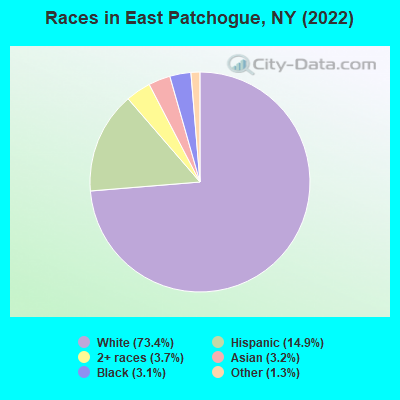
Ancestries: Italian (22.7%), Irish (13.5%), Turkish (6.7%), German (4.9%), American (3.3%), Polish (1.7%).
Current Local Time: EST time zone
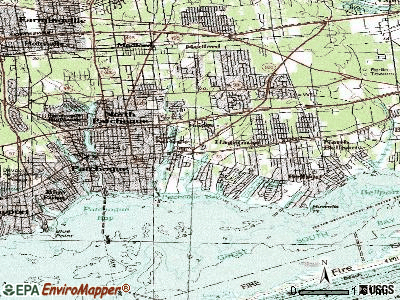
Land area: 8.32 square miles.
Population density: 2,702 people per square mile (average).
2,897 residents are foreign born (7.5% Latin America, 3.0% Asia, 2.0% Europe).
This place:
13.6%
New York:
22.6%
Median real estate property taxes paid for housing units with mortgages in 2023: $9,508 (1.9%) Median real estate property taxes paid for housing units with no mortgage in 2023: $9,969 (2.0%)
Nearest city with pop. 50,000+: Brentwood, NY (13.7 miles , pop. 53,917).
Nearest city with pop. 200,000+: North Hempstead, NY (35.8 miles , pop. 222,611).
Nearest city with pop. 1,000,000+: Queens, NY (44.0 miles , pop. 2,229,379).
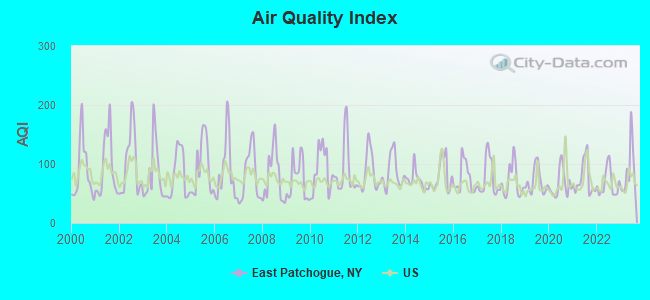
Air Quality Index (AQI) level in 2023 was 88.3. This is worse than average.
City:
88.3
U.S.:
72.6
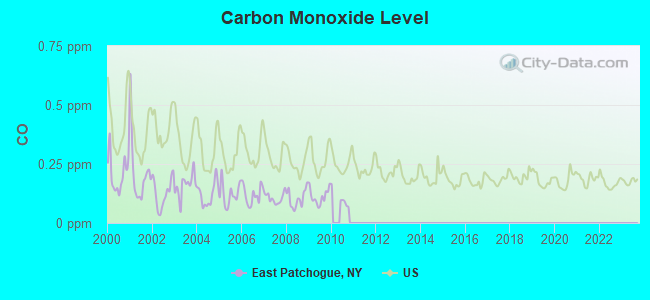
Carbon Monoxide (CO) [ppm] level in 2009 was 0.112. This is significantly better than average.Closest monitor was 5.7 miles away from the city center.
City:
0.112
U.S.:
0.251
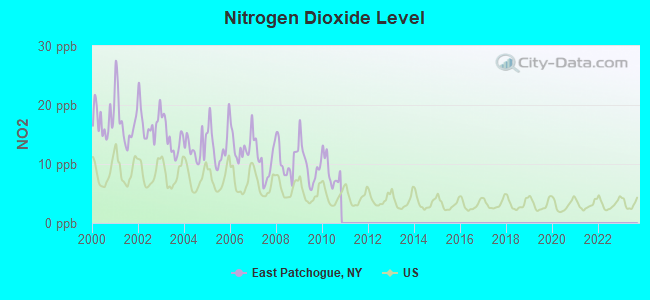
Nitrogen Dioxide (NO2) [ppb] level in 2010 was 8.78. This is significantly worse than average.Closest monitor was 5.7 miles away from the city center.
City:
8.78
U.S.:
5.11
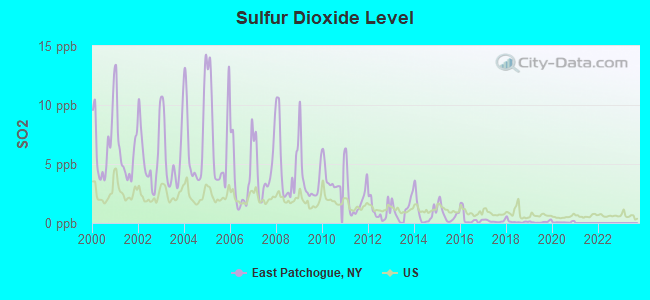
Sulfur Dioxide (SO2) [ppb] level in 2020 was 0.0629. This is significantly better than average.Closest monitor was 5.7 miles away from the city center.
City:
0.0629
U.S.:
1.5147
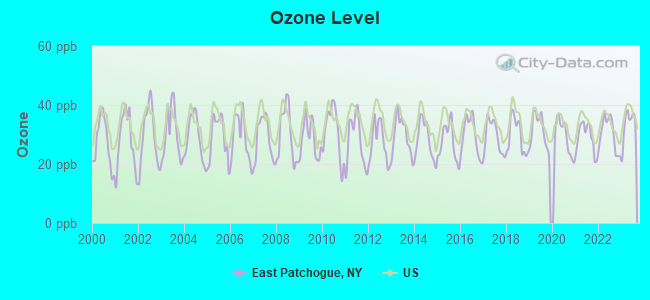
Ozone [ppb] level in 2023 was 33.4. This is about average.Closest monitor was 5.7 miles away from the city center.
City:
33.4
U.S.:
33.3
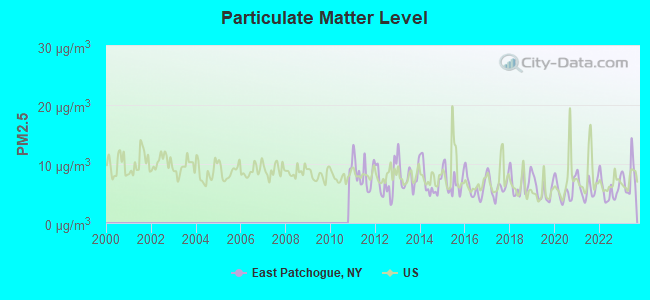
Particulate Matter (PM2.5) [µg/m3] level in 2023 was 7.79. This is about average.Closest monitor was 22.9 miles away from the city center.
City:
7.79
U.S.:
8.11
Tornado activity:
East Patchogue-area historical tornado activity is near New York state average. It is 64% smaller than the overall U.S. average.
On 7/10/1989, a category F4 (max. wind speeds 207-260 mph) tornado 38.3 miles away from the East Patchogue place center injured 40 peopleand causedbetween $50,000,000 and $500,000,000 in damages.
On 7/10/1989, a category F2 (max. wind speeds 113-157 mph) tornado 11.2 miles away from the place center injured one person.
Earthquake activity:
East Patchogue-area historical earthquake activity is significantly above New York state average. It is 72% smaller than the overall U.S. average.
On 10/7/1983 at 10:18:46, a magnitude 5.3 (5.1 MB, 5.3 LG, 5.1 ML, Class: Moderate, Intensity: VI - VII) earthquake occurred 230.9 miles away from the city center On 8/23/2011 at 17:51:04, a magnitude 5.8 (5.8 MW, Depth: 3.7 mi) earthquake occurred 330.5 miles away from East Patchogue center On 4/20/2002 at 10:50:47, a magnitude 5.3 (5.3 ML, Depth: 3.0 mi) earthquake occurred 261.5 miles away from East Patchogue center On 8/22/1992 at 12:20:32, a magnitude 4.8 (4.8 MB, 3.8 MS, 4.7 LG, Depth: 6.2 mi, Class: Light, Intensity: IV - V) earthquake occurred 182.1 miles away from the city center On 4/20/2002 at 10:50:47, a magnitude 5.2 (5.2 MB, 4.2 MS, 5.2 MW, 5.0 MW) earthquake occurred 259.9 miles away from East Patchogue center On 1/16/1994 at 01:49:16, a magnitude 4.6 (4.6 MB, 4.6 LG, Depth: 3.1 mi) earthquake occurred 163.3 miles away from the city center Magnitude types: regional Lg-wave magnitude (LG), body-wave magnitude (MB), local magnitude (ML), surface-wave magnitude (MS), moment magnitude (MW)
Natural disasters:
The number of natural disasters in Suffolk County (35) is a lot greater than the US average (19). Major Disasters (Presidential) Declared: 19 Emergencies Declared: 7
Causes of natural disasters: Hurricanes: 12, Floods: 9, Storms: 9, Snowstorms: 5, Winter Storms: 4, Blizzards: 2, Heavy Rain: 1, Power Outage: 1, Tropical Depression: 1, Tropical Storm: 1, Water Shortage: 1, Other: 4 (Note: some incidents may be assigned to more than one category).
Hospitals and medical centers in East Patchogue:
BROOKHAVEN HEALTH CARE FACILITY L L C (801 GAZZOLA BLVD)
Other hospitals and medical centers near East Patchogue:
BROOKHAVEN MEMORIAL HOSPITAL MEDICAL CENTER (Dialysis Facility, about 1 miles away; PATCHOGUE, NY)
BROOKHAVEN MEMORIAL HOSPITAL MEDICAL CENTER Acute Care Hospitals (about 1 miles away; PATCHOGUE, NY)
BROOKHAVEN MEM HOSP CHHA (Home Health Center, about 2 miles away; PATCHOGUE, NY)
BROOKHAVEN MEM HOSP MEDICAL CTR HOSPICE (Hospital, about 2 miles away; PATCHOGUE, NY)
BROOKHAVEN MEMORIAL HOSP (Dialysis Facility, about 2 miles away; PATCHOGUE, NY)
BELLHAVEN NURSING AND REHAB CENTER (Nursing Home, about 3 miles away; BROOKHAVEN, NY)
DEVELOPMENTAL DISABILITIES INSTITUTE (Hospital, about 4 miles away; MEDFORD, NY)
Colleges/universities with over 2000 students nearest to East Patchogue:
Suffolk County Community College (about 7 miles; Selden, NY; Full-time enrollment: 18,540)
Dowling College (about 10 miles; Oakdale, NY; FT enrollment: 2,598)
Stony Brook University (about 13 miles; Stony Brook, NY; FT enrollment: 22,071)
Farmingdale State College (about 24 miles; Farmingdale, NY; FT enrollment: 6,956)
Briarcliffe College (about 27 miles; Bethpage, NY; FT enrollment: 2,134)
Porter and Chester Institute of Stratford (about 30 miles; Stratford, CT; FT enrollment: 2,822)
University of Bridgeport (about 30 miles; Bridgeport, CT; FT enrollment: 3,708)
Public elementary/middle school in East Patchogue:
Churches in East Patchogue include: Baha'i Faith in the Town (A), Good News Church of Jesus (B), Grace Gospel Church (C), Kingdom Hall of Jehovah's Witnesses (D), Oasis Christian Center (E), Brookhaven Church (F). Display/hide their locations on the map
Religion statistics for East Patchogue, NY (based on Suffolk County data)
Religion
Adherents
Congregations
Catholic
879,457
75
Mainline Protestant
69,205
182
Evangelical Protestant
58,909
264
Other
50,771
124
Orthodox
10,190
10
Black Protestant
8,298
49
None
416,520
-
Source: Clifford Grammich, Kirk Hadaway, Richard Houseal, Dale E.Jones, Alexei Krindatch, Richie Stanley and Richard H.Taylor. 2012. 2010 U.S.Religion Census: Religious Congregations & Membership Study. Association of Statisticians of American Religious Bodies. Jones, Dale E., et al. 2002. Congregations and Membership in the United States 2000. Nashville, TN: Glenmary Research Center. Graphs represent county-level data
Aircraft: WREDE TIMOTHY H R SONEX-B (Category: Land, Seats: 2, Weight: Up to 12,499 Pounds), Engine: Reciprocating N-Number: 307TW, N307TW, N-307TW, Serial Number: SNB-0018, Certificate Issue Date: 06/28/2018 Registrant (Individual): Timothy H R Wrede, 224 Hospital Rd, East Patchogue, NY 11772 Deregistered:Cancel Date: 06/26/2001, Exported to: Dominican Republic
Aircraft: DJI PHANTOM 4 PRO (Category: Land, Engines: 4), Engine: Electric N-Number: 631JF, N631JF, N-631JF, Serial Number: 0AXCE4A0A30797, Certificate Issue Date: 11/02/2017 Registrant (Individual): Joseph R Fagan, 7 N William St, East Patchogue, NY 11772
Aircraft: SIX CHUTER SR7 XL (Category: Land, Seats: 2, Weight: Up to 12,499 Pounds), Engine: ROTAX 582DCDI (65 HP) (2 Cycle) N-Number: 7099J, N7099J, N-7099J, Serial Number: SR7XL-2458, Year manufactured: 2000, Airworthiness Date: 01/15/2008, Certificate Issue Date: 06/21/2007 Registrant (Individual): Dominic Savio, 182 Union Ave, East Patchogue, NY 11772
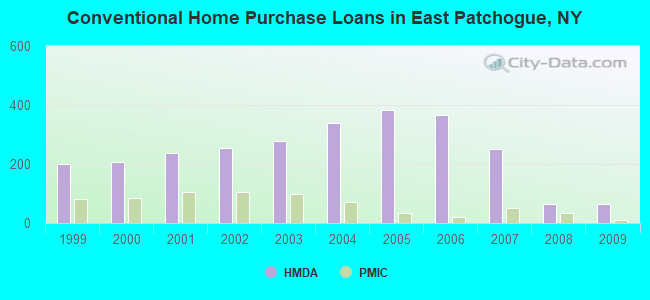
Home Mortgage Disclosure Act Aggregated Statistics For Year 2009 (Based on 4 full tracts)
A) FHA, FSA/RHS & VA Home Purchase Loans
B) Conventional Home Purchase Loans
C) Refinancings
D) Home Improvement Loans
E) Loans on Dwellings For 5+ Families
F) Non-occupant Loans on < 5 Family Dwellings (A B C & D)
Number
Average Value
Number
Average Value
Number
Average Value
Number
Average Value
Number
Average Value
Number
Average Value
LOANS ORIGINATED
60
$270,883
63
$248,080
251
$223,224
26
$111,558
1
$10,900,000
17
$270,235
APPLICATIONS APPROVED, NOT ACCEPTED
6
$278,390
11
$241,364
37
$252,752
2
$106,500
0
$0
3
$170,333
APPLICATIONS DENIED
14
$236,786
15
$246,733
115
$273,738
16
$40,576
0
$0
7
$224,804
APPLICATIONS WITHDRAWN
11
$250,455
10
$198,198
82
$241,380
2
$30,000
0
$0
5
$159,600
FILES CLOSED FOR INCOMPLETENESS
2
$264,000
2
$273,545
19
$224,889
2
$30,340
0
$0
0
$0
Aggregated Statistics For Year 2008 (Based on 4 full tracts)
A) FHA, FSA/RHS & VA Home Purchase Loans
B) Conventional Home Purchase Loans
C) Refinancings
D) Home Improvement Loans
E) Loans on Dwellings For 5+ Families
F) Non-occupant Loans on < 5 Family Dwellings (A B C & D)
G) Loans On Manufactured Home Dwelling (A B C & D)
Number
Average Value
Number
Average Value
Number
Average Value
Number
Average Value
Number
Average Value
Number
Average Value
Number
Average Value
LOANS ORIGINATED
37
$296,564
64
$250,786
148
$203,907
46
$82,314
3
$12,541,667
10
$192,118
0
$0
APPLICATIONS APPROVED, NOT ACCEPTED
1
$290,450
19
$245,435
32
$279,833
11
$105,091
0
$0
7
$326,186
1
$80,000
APPLICATIONS DENIED
10
$285,200
29
$275,682
134
$272,706
31
$67,421
0
$0
7
$205,000
0
$0
APPLICATIONS WITHDRAWN
5
$324,800
17
$224,359
57
$264,314
12
$122,682
0
$0
4
$65,788
0
$0
FILES CLOSED FOR INCOMPLETENESS
4
$275,250
10
$279,700
23
$297,877
0
$0
0
$0
1
$240,000
0
$0
Aggregated Statistics For Year 2007 (Based on 4 full tracts)
A) FHA, FSA/RHS & VA Home Purchase Loans
B) Conventional Home Purchase Loans
C) Refinancings
D) Home Improvement Loans
E) Loans on Dwellings For 5+ Families
F) Non-occupant Loans on < 5 Family Dwellings (A B C & D)
Number
Average Value
Number
Average Value
Number
Average Value
Number
Average Value
Number
Average Value
Number
Average Value
LOANS ORIGINATED
15
$336,386
251
$239,230
325
$224,377
106
$76,929
4
$3,058,020
23
$242,432
APPLICATIONS APPROVED, NOT ACCEPTED
0
$0
48
$242,532
95
$241,601
21
$58,293
0
$0
2
$290,500
APPLICATIONS DENIED
2
$325,160
67
$277,402
288
$291,093
64
$106,194
0
$0
20
$241,551
APPLICATIONS WITHDRAWN
0
$0
33
$245,474
99
$253,011
20
$170,003
2
$368,000
7
$373,556
FILES CLOSED FOR INCOMPLETENESS
0
$0
9
$320,638
38
$254,712
2
$70,000
0
$0
1
$205,000
Aggregated Statistics For Year 2006 (Based on 4 full tracts)
A) FHA, FSA/RHS & VA Home Purchase Loans
B) Conventional Home Purchase Loans
C) Refinancings
D) Home Improvement Loans
E) Loans on Dwellings For 5+ Families
F) Non-occupant Loans on < 5 Family Dwellings (A B C & D)
G) Loans On Manufactured Home Dwelling (A B C & D)
Number
Average Value
Number
Average Value
Number
Average Value
Number
Average Value
Number
Average Value
Number
Average Value
Number
Average Value
LOANS ORIGINATED
2
$322,625
365
$223,548
522
$222,357
113
$106,954
2
$10,234,000
34
$253,831
1
$84,550
APPLICATIONS APPROVED, NOT ACCEPTED
0
$0
46
$214,767
94
$223,035
21
$72,083
0
$0
6
$275,052
0
$0
APPLICATIONS DENIED
0
$0
110
$227,823
296
$263,638
71
$109,917
0
$0
33
$258,509
4
$60,000
APPLICATIONS WITHDRAWN
1
$100,000
69
$220,794
197
$244,567
26
$180,334
0
$0
13
$287,215
0
$0
FILES CLOSED FOR INCOMPLETENESS
0
$0
11
$256,766
76
$280,849
9
$81,340
0
$0
3
$199,213
0
$0
Aggregated Statistics For Year 2005 (Based on 4 full tracts)
A) FHA, FSA/RHS & VA Home Purchase Loans
B) Conventional Home Purchase Loans
C) Refinancings
D) Home Improvement Loans
E) Loans on Dwellings For 5+ Families
F) Non-occupant Loans on < 5 Family Dwellings (A B C & D)
G) Loans On Manufactured Home Dwelling (A B C & D)
Number
Average Value
Number
Average Value
Number
Average Value
Number
Average Value
Number
Average Value
Number
Average Value
Number
Average Value
LOANS ORIGINATED
4
$267,250
383
$230,956
562
$220,480
122
$103,365
3
$4,600,950
39
$260,991
2
$60,500
APPLICATIONS APPROVED, NOT ACCEPTED
0
$0
49
$262,038
107
$229,764
27
$66,596
0
$0
4
$307,202
0
$0
APPLICATIONS DENIED
1
$306,370
92
$233,673
213
$252,731
65
$100,372
0
$0
16
$239,960
0
$0
APPLICATIONS WITHDRAWN
1
$269,560
81
$219,958
205
$241,623
27
$197,056
1
$200,000
12
$293,195
0
$0
FILES CLOSED FOR INCOMPLETENESS
1
$295,000
25
$245,520
131
$240,233
8
$100,836
0
$0
2
$252,000
0
$0
Aggregated Statistics For Year 2004 (Based on 4 full tracts)
A) FHA, FSA/RHS & VA Home Purchase Loans
B) Conventional Home Purchase Loans
C) Refinancings
D) Home Improvement Loans
F) Non-occupant Loans on < 5 Family Dwellings (A B C & D)
G) Loans On Manufactured Home Dwelling (A B C & D)
Number
Average Value
Number
Average Value
Number
Average Value
Number
Average Value
Number
Average Value
Number
Average Value
LOANS ORIGINATED
13
$246,187
338
$234,189
661
$193,237
137
$92,448
37
$244,085
9
$54,667
APPLICATIONS APPROVED, NOT ACCEPTED
1
$267,000
47
$246,341
136
$200,180
25
$54,925
13
$175,494
0
$0
APPLICATIONS DENIED
1
$286,000
72
$237,673
237
$228,071
91
$111,847
22
$259,009
4
$48,725
APPLICATIONS WITHDRAWN
4
$257,872
49
$220,753
273
$201,334
25
$138,638
10
$187,500
1
$275,000
FILES CLOSED FOR INCOMPLETENESS
0
$0
18
$206,924
104
$226,600
14
$112,576
3
$170,657
0
$0
Aggregated Statistics For Year 2003 (Based on 4 full tracts)
A) FHA, FSA/RHS & VA Home Purchase Loans
B) Conventional Home Purchase Loans
C) Refinancings
D) Home Improvement Loans
F) Non-occupant Loans on < 5 Family Dwellings (A B C & D)
Number
Average Value
Number
Average Value
Number
Average Value
Number
Average Value
Number
Average Value
LOANS ORIGINATED
33
$244,527
277
$227,527
1,210
$167,099
111
$43,372
50
$174,124
APPLICATIONS APPROVED, NOT ACCEPTED
2
$260,000
34
$238,536
193
$153,402
35
$42,828
5
$207,200
APPLICATIONS DENIED
5
$251,800
47
$248,608
342
$172,194
79
$31,724
21
$158,943
APPLICATIONS WITHDRAWN
6
$262,500
38
$208,075
307
$180,678
23
$65,251
6
$193,783
FILES CLOSED FOR INCOMPLETENESS
3
$239,923
18
$234,333
56
$177,063
4
$60,000
0
$0
Aggregated Statistics For Year 2002 (Based on 4 full tracts)
A) FHA, FSA/RHS & VA Home Purchase Loans
B) Conventional Home Purchase Loans
C) Refinancings
D) Home Improvement Loans
E) Loans on Dwellings For 5+ Families
F) Non-occupant Loans on < 5 Family Dwellings (A B C & D)
Number
Average Value
Number
Average Value
Number
Average Value
Number
Average Value
Number
Average Value
Number
Average Value
LOANS ORIGINATED
42
$195,684
254
$189,509
782
$145,094
137
$35,014
2
$189,500
37
$143,839
APPLICATIONS APPROVED, NOT ACCEPTED
3
$159,567
44
$208,983
129
$134,329
38
$36,515
0
$0
4
$187,290
APPLICATIONS DENIED
5
$235,000
29
$204,681
241
$148,410
87
$29,709
0
$0
10
$155,601
APPLICATIONS WITHDRAWN
8
$188,964
33
$218,743
241
$141,665
46
$32,215
0
$0
10
$120,240
FILES CLOSED FOR INCOMPLETENESS
4
$173,500
8
$159,405
67
$137,064
5
$32,148
0
$0
3
$103,667
Aggregated Statistics For Year 2001 (Based on 4 full tracts)
A) FHA, FSA/RHS & VA Home Purchase Loans
B) Conventional Home Purchase Loans
C) Refinancings
D) Home Improvement Loans
E) Loans on Dwellings For 5+ Families
F) Non-occupant Loans on < 5 Family Dwellings (A B C & D)
Number
Average Value
Number
Average Value
Number
Average Value
Number
Average Value
Number
Average Value
Number
Average Value
LOANS ORIGINATED
53
$167,982
238
$164,632
583
$126,490
110
$42,820
3
$8,375,333
28
$133,573
APPLICATIONS APPROVED, NOT ACCEPTED
3
$166,040
34
$190,609
124
$110,100
34
$41,678
0
$0
7
$131,907
APPLICATIONS DENIED
6
$145,572
42
$177,164
262
$120,219
80
$28,725
0
$0
10
$103,832
APPLICATIONS WITHDRAWN
15
$152,733
32
$197,880
182
$125,715
35
$28,093
0
$0
1
$73,000
FILES CLOSED FOR INCOMPLETENESS
1
$134,000
8
$154,049
50
$127,748
8
$23,984
0
$0
0
$0
Aggregated Statistics For Year 2000 (Based on 4 full tracts)
A) FHA, FSA/RHS & VA Home Purchase Loans
B) Conventional Home Purchase Loans
C) Refinancings
D) Home Improvement Loans
E) Loans on Dwellings For 5+ Families
F) Non-occupant Loans on < 5 Family Dwellings (A B C & D)
Number
Average Value
Number
Average Value
Number
Average Value
Number
Average Value
Number
Average Value
Number
Average Value
LOANS ORIGINATED
52
$141,967
207
$140,849
185
$95,334
90
$28,052
2
$1,188,500
12
$98,464
APPLICATIONS APPROVED, NOT ACCEPTED
1
$106,000
19
$158,184
53
$90,076
36
$41,166
0
$0
5
$85,816
APPLICATIONS DENIED
12
$142,105
70
$144,687
176
$91,374
73
$34,511
0
$0
8
$124,359
APPLICATIONS WITHDRAWN
10
$138,519
24
$128,092
147
$78,410
17
$48,581
1
$330,000
6
$90,957
FILES CLOSED FOR INCOMPLETENESS
2
$127,000
3
$193,000
29
$115,971
6
$32,658
0
$0
1
$112,000
Aggregated Statistics For Year 1999 (Based on 4 full tracts)
A) FHA, FSA/RHS & VA Home Purchase Loans
B) Conventional Home Purchase Loans
C) Refinancings
D) Home Improvement Loans
F) Non-occupant Loans on < 5 Family Dwellings (A B C & D)
2003 - 2018 National Fire Incident Reporting System (NFIRS) incidents
According to the data from the years 2003 - 2018 the average number of fire incidents per year is 42. The highest number of reported fire incidents - 82 took place in 2014, and the least - 1 in 2005. The data has a growing trend.
When looking into fire subcategories, the most reports belonged to: Structure Fires (59.8%), and Outside Fires (28.0%).
Fire incident types reported to NFIRS in East Patchogue, NY


 Recent articles from our blog. Our writers, many of them Ph.D. graduates or candidates, create easy-to-read articles on a wide variety of topics.
 (13.7 miles
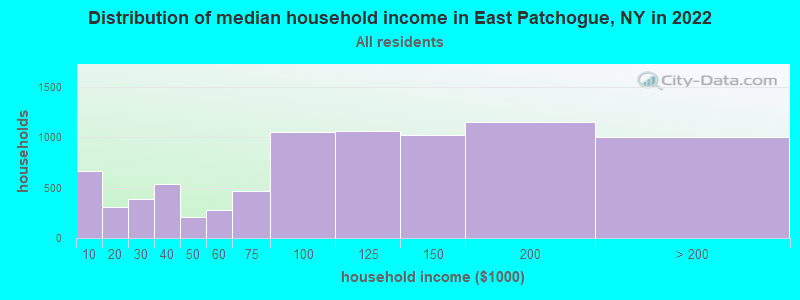


 According to the data from the years 2003 - 2018 the average number of fire incidents per year is 42. The highest number of reported fire incidents - 82 took place in 2014, and the least - 1 in 2005. The data has a growing trend.
 When looking into fire subcategories, the most reports belonged to: Structure Fires (59.8%), and Outside Fires (28.0%).