Commack, New York Submit your own pictures of this place and show them to the world
OSM Map
General Map
Google Map
MSN Map
OSM Map
General Map
Google Map
MSN Map
OSM Map
General Map
Google Map
MSN Map
OSM Map
General Map
Google Map
MSN Map
Please wait while loading the map...
Population in 2010: 36,124. Population change since 2000: -0.7%Males: 18,030 Females: 18,094
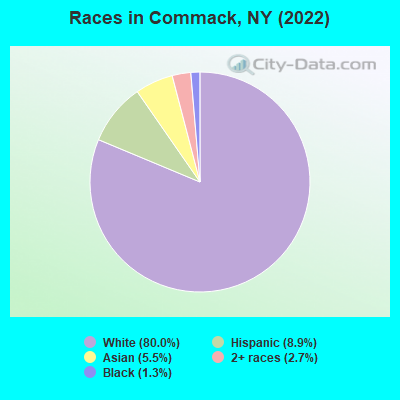
December 2024 cost of living index in Commack: 149.5 (very high, U.S. average is 100) Percentage of residents living in poverty in 2023: 3.4%for White Non-Hispanic residents , 19.3% for Black residents , 8.2% for Hispanic or Latino residents , 8.6% for other race residents , 3.9% for two or more races residents )
Profiles of local businesses
Business Search - 14 Million verified businesses
Data:
Median household income ($)
Median household income (% change since 2000)
Household income diversity
Ratio of average income to average house value (%)
Ratio of average income to average rent
Median household income ($) - White
Median household income ($) - Black or African American
Median household income ($) - Asian
Median household income ($) - Hispanic or Latino
Median household income ($) - American Indian and Alaska Native
Median household income ($) - Multirace
Median household income ($) - Other Race
Median household income for houses/condos with a mortgage ($)
Median household income for apartments without a mortgage ($)
Races - White alone (%)
Races - White alone (% change since 2000)
Races - Black alone (%)
Races - Black alone (% change since 2000)
Races - American Indian alone (%)
Races - American Indian alone (% change since 2000)
Races - Asian alone (%)
Races - Asian alone (% change since 2000)
Races - Hispanic (%)
Races - Hispanic (% change since 2000)
Races - Native Hawaiian and Other Pacific Islander alone (%)
Races - Native Hawaiian and Other Pacific Islander alone (% change since 2000)
Races - Two or more races (%)
Races - Two or more races (% change since 2000)
Races - Other race alone (%)
Races - Other race alone (% change since 2000)
Racial diversity
Unemployment (%)
Unemployment (% change since 2000)
Unemployment (%) - White
Unemployment (%) - Black or African American
Unemployment (%) - Asian
Unemployment (%) - Hispanic or Latino
Unemployment (%) - American Indian and Alaska Native
Unemployment (%) - Multirace
Unemployment (%) - Other Race
Population density (people per square mile)
Population - Males (%)
Population - Females (%)
Population - Males (%) - White
Population - Males (%) - Black or African American
Population - Males (%) - Asian
Population - Males (%) - Hispanic or Latino
Population - Males (%) - American Indian and Alaska Native
Population - Males (%) - Multirace
Population - Males (%) - Other Race
Population - Females (%) - White
Population - Females (%) - Black or African American
Population - Females (%) - Asian
Population - Females (%) - Hispanic or Latino
Population - Females (%) - American Indian and Alaska Native
Population - Females (%) - Multirace
Population - Females (%) - Other Race
Coronavirus confirmed cases (Apr 28, 2025)
Deaths caused by coronavirus (Apr 28, 2025)
Coronavirus confirmed cases (per 100k population) (Apr 28, 2025)
Deaths caused by coronavirus (per 100k population) (Apr 28, 2025)
Daily increase in number of cases (Apr 28, 2025)
Weekly increase in number of cases (Apr 28, 2025)
Cases doubled (in days) (Apr 28, 2025)
Hospitalized patients (Apr 18, 2022)
Negative test results (Apr 18, 2022)
Total test results (Apr 18, 2022)
COVID Vaccine doses distributed (per 100k population) (Sep 19, 2023)
COVID Vaccine doses administered (per 100k population) (Sep 19, 2023)
COVID Vaccine doses distributed (Sep 19, 2023)
COVID Vaccine doses administered (Sep 19, 2023)
Likely homosexual households (%)
Likely homosexual households (% change since 2000)
Likely homosexual households - Lesbian couples (%)
Likely homosexual households - Lesbian couples (% change since 2000)
Likely homosexual households - Gay men (%)
Likely homosexual households - Gay men (% change since 2000)
Cost of living index
Median gross rent ($)
Median contract rent ($)
Median monthly housing costs ($)
Median house or condo value ($)
Median house or condo value ($ change since 2000)
Mean house or condo value by units in structure - 1, detached ($)
Mean house or condo value by units in structure - 1, attached ($)
Mean house or condo value by units in structure - 2 ($)
Mean house or condo value by units in structure by units in structure - 3 or 4 ($)
Mean house or condo value by units in structure - 5 or more ($)
Mean house or condo value by units in structure - Boat, RV, van, etc. ($)
Mean house or condo value by units in structure - Mobile home ($)
Median house or condo value ($) - White
Median house or condo value ($) - Black or African American
Median house or condo value ($) - Asian
Median house or condo value ($) - Hispanic or Latino
Median house or condo value ($) - American Indian and Alaska Native
Median house or condo value ($) - Multirace
Median house or condo value ($) - Other Race
Median resident age
Resident age diversity
Median resident age - Males
Median resident age - Females
Median resident age - White
Median resident age - Black or African American
Median resident age - Asian
Median resident age - Hispanic or Latino
Median resident age - American Indian and Alaska Native
Median resident age - Multirace
Median resident age - Other Race
Median resident age - Males - White
Median resident age - Males - Black or African American
Median resident age - Males - Asian
Median resident age - Males - Hispanic or Latino
Median resident age - Males - American Indian and Alaska Native
Median resident age - Males - Multirace
Median resident age - Males - Other Race
Median resident age - Females - White
Median resident age - Females - Black or African American
Median resident age - Females - Asian
Median resident age - Females - Hispanic or Latino
Median resident age - Females - American Indian and Alaska Native
Median resident age - Females - Multirace
Median resident age - Females - Other Race
Commute - mean travel time to work (minutes)
Travel time to work - Less than 5 minutes (%)
Travel time to work - Less than 5 minutes (% change since 2000)
Travel time to work - 5 to 9 minutes (%)
Travel time to work - 5 to 9 minutes (% change since 2000)
Travel time to work - 10 to 19 minutes (%)
Travel time to work - 10 to 19 minutes (% change since 2000)
Travel time to work - 20 to 29 minutes (%)
Travel time to work - 20 to 29 minutes (% change since 2000)
Travel time to work - 30 to 39 minutes (%)
Travel time to work - 30 to 39 minutes (% change since 2000)
Travel time to work - 40 to 59 minutes (%)
Travel time to work - 40 to 59 minutes (% change since 2000)
Travel time to work - 60 to 89 minutes (%)
Travel time to work - 60 to 89 minutes (% change since 2000)
Travel time to work - 90 or more minutes (%)
Travel time to work - 90 or more minutes (% change since 2000)
Marital status - Never married (%)
Marital status - Now married (%)
Marital status - Separated (%)
Marital status - Widowed (%)
Marital status - Divorced (%)
Median family income ($)
Median family income (% change since 2000)
Median non-family income ($)
Median non-family income (% change since 2000)
Median per capita income ($)
Median per capita income (% change since 2000)
Median family income ($) - White
Median family income ($) - Black or African American
Median family income ($) - Asian
Median family income ($) - Hispanic or Latino
Median family income ($) - American Indian and Alaska Native
Median family income ($) - Multirace
Median family income ($) - Other Race
Median year house/condo built
Median year apartment built
Year house built - Built 2005 or later (%)
Year house built - Built 2000 to 2004 (%)
Year house built - Built 1990 to 1999 (%)
Year house built - Built 1980 to 1989 (%)
Year house built - Built 1970 to 1979 (%)
Year house built - Built 1960 to 1969 (%)
Year house built - Built 1950 to 1959 (%)
Year house built - Built 1940 to 1949 (%)
Year house built - Built 1939 or earlier (%)
Average household size
Household density (households per square mile)
Average household size - White
Average household size - Black or African American
Average household size - Asian
Average household size - Hispanic or Latino
Average household size - American Indian and Alaska Native
Average household size - Multirace
Average household size - Other Race
Occupied housing units (%)
Vacant housing units (%)
Owner occupied housing units (%)
Renter occupied housing units (%)
Vacancy status - For rent (%)
Vacancy status - For sale only (%)
Vacancy status - Rented or sold, not occupied (%)
Vacancy status - For seasonal, recreational, or occasional use (%)
Vacancy status - For migrant workers (%)
Vacancy status - Other vacant (%)
Residents with income below the poverty level (%)
Residents with income below 50% of the poverty level (%)
Children below poverty level (%)
Poor families by family type - Married-couple family (%)
Poor families by family type - Male, no wife present (%)
Poor families by family type - Female, no husband present (%)
Poverty status for native-born residents (%)
Poverty status for foreign-born residents (%)
Poverty among high school graduates not in families (%)
Poverty among people who did not graduate high school not in families (%)
Residents with income below the poverty level (%) - White
Residents with income below the poverty level (%) - Black or African American
Residents with income below the poverty level (%) - Asian
Residents with income below the poverty level (%) - Hispanic or Latino
Residents with income below the poverty level (%) - American Indian and Alaska Native
Residents with income below the poverty level (%) - Multirace
Residents with income below the poverty level (%) - Other Race
Air pollution - Air Quality Index (AQI)
Air pollution - CO
Air pollution - NO2
Air pollution - SO2
Air pollution - Ozone
Air pollution - PM10
Air pollution - PM25
Air pollution - Pb
Crime - Murders per 100,000 population
Crime - Rapes per 100,000 population
Crime - Robberies per 100,000 population
Crime - Assaults per 100,000 population
Crime - Burglaries per 100,000 population
Crime - Thefts per 100,000 population
Crime - Auto thefts per 100,000 population
Crime - Arson per 100,000 population
Crime - City-data.com crime index
Crime - Violent crime index
Crime - Property crime index
Crime - Murders per 100,000 population (5 year average)
Crime - Rapes per 100,000 population (5 year average)
Crime - Robberies per 100,000 population (5 year average)
Crime - Assaults per 100,000 population (5 year average)
Crime - Burglaries per 100,000 population (5 year average)
Crime - Thefts per 100,000 population (5 year average)
Crime - Auto thefts per 100,000 population (5 year average)
Crime - Arson per 100,000 population (5 year average)
Crime - City-data.com crime index (5 year average)
Crime - Violent crime index (5 year average)
Crime - Property crime index (5 year average)
1996 Presidential Elections Results (%) - Democratic Party (Clinton)
1996 Presidential Elections Results (%) - Republican Party (Dole)
1996 Presidential Elections Results (%) - Other
2000 Presidential Elections Results (%) - Democratic Party (Gore)
2000 Presidential Elections Results (%) - Republican Party (Bush)
2000 Presidential Elections Results (%) - Other
2004 Presidential Elections Results (%) - Democratic Party (Kerry)
2004 Presidential Elections Results (%) - Republican Party (Bush)
2004 Presidential Elections Results (%) - Other
2008 Presidential Elections Results (%) - Democratic Party (Obama)
2008 Presidential Elections Results (%) - Republican Party (McCain)
2008 Presidential Elections Results (%) - Other
2012 Presidential Elections Results (%) - Democratic Party (Obama)
2012 Presidential Elections Results (%) - Republican Party (Romney)
2012 Presidential Elections Results (%) - Other
2016 Presidential Elections Results (%) - Democratic Party (Clinton)
2016 Presidential Elections Results (%) - Republican Party (Trump)
2016 Presidential Elections Results (%) - Other
2020 Presidential Elections Results (%) - Democratic Party (Biden)
2020 Presidential Elections Results (%) - Republican Party (Trump)
2020 Presidential Elections Results (%) - Other
Ancestries Reported - Arab (%)
Ancestries Reported - Czech (%)
Ancestries Reported - Danish (%)
Ancestries Reported - Dutch (%)
Ancestries Reported - English (%)
Ancestries Reported - French (%)
Ancestries Reported - French Canadian (%)
Ancestries Reported - German (%)
Ancestries Reported - Greek (%)
Ancestries Reported - Hungarian (%)
Ancestries Reported - Irish (%)
Ancestries Reported - Italian (%)
Ancestries Reported - Lithuanian (%)
Ancestries Reported - Norwegian (%)
Ancestries Reported - Polish (%)
Ancestries Reported - Portuguese (%)
Ancestries Reported - Russian (%)
Ancestries Reported - Scotch-Irish (%)
Ancestries Reported - Scottish (%)
Ancestries Reported - Slovak (%)
Ancestries Reported - Subsaharan African (%)
Ancestries Reported - Swedish (%)
Ancestries Reported - Swiss (%)
Ancestries Reported - Ukrainian (%)
Ancestries Reported - United States (%)
Ancestries Reported - Welsh (%)
Ancestries Reported - West Indian (%)
Ancestries Reported - Other (%)
Educational Attainment - No schooling completed (%)
Educational Attainment - Less than high school (%)
Educational Attainment - High school or equivalent (%)
Educational Attainment - Less than 1 year of college (%)
Educational Attainment - 1 or more years of college (%)
Educational Attainment - Associate degree (%)
Educational Attainment - Bachelor's degree (%)
Educational Attainment - Master's degree (%)
Educational Attainment - Professional school degree (%)
Educational Attainment - Doctorate degree (%)
School Enrollment - Nursery, preschool (%)
School Enrollment - Kindergarten (%)
School Enrollment - Grade 1 to 4 (%)
School Enrollment - Grade 5 to 8 (%)
School Enrollment - Grade 9 to 12 (%)
School Enrollment - College undergrad (%)
School Enrollment - Graduate or professional (%)
School Enrollment - Not enrolled in school (%)
School enrollment - Public schools (%)
School enrollment - Private schools (%)
School enrollment - Not enrolled (%)
Median number of rooms in houses and condos
Median number of rooms in apartments
Housing units lacking complete plumbing facilities (%)
Housing units lacking complete kitchen facilities (%)
Density of houses
Urban houses (%)
Rural houses (%)
Households with people 60 years and over (%)
Households with people 65 years and over (%)
Households with people 75 years and over (%)
Households with one or more nonrelatives (%)
Households with no nonrelatives (%)
Population in households (%)
Family households (%)
Nonfamily households (%)
Population in families (%)
Family households with own children (%)
Median number of bedrooms in owner occupied houses
Mean number of bedrooms in owner occupied houses
Median number of bedrooms in renter occupied houses
Mean number of bedrooms in renter occupied houses
Median number of vehichles in owner occupied houses
Mean number of vehichles in owner occupied houses
Median number of vehichles in renter occupied houses
Mean number of vehichles in renter occupied houses
Mortgage status - with mortgage (%)
Mortgage status - with second mortgage (%)
Mortgage status - with home equity loan (%)
Mortgage status - with both second mortgage and home equity loan (%)
Mortgage status - without a mortgage (%)
Average family size
Average family size - White
Average family size - Black or African American
Average family size - Asian
Average family size - Hispanic or Latino
Average family size - American Indian and Alaska Native
Average family size - Multirace
Average family size - Other Race
Geographical mobility - Same house 1 year ago (%)
Geographical mobility - Moved within same county (%)
Geographical mobility - Moved from different county within same state (%)
Geographical mobility - Moved from different state (%)
Geographical mobility - Moved from abroad (%)
Place of birth - Born in state of residence (%)
Place of birth - Born in other state (%)
Place of birth - Native, outside of US (%)
Place of birth - Foreign born (%)
Housing units in structures - 1, detached (%)
Housing units in structures - 1, attached (%)
Housing units in structures - 2 (%)
Housing units in structures - 3 or 4 (%)
Housing units in structures - 5 to 9 (%)
Housing units in structures - 10 to 19 (%)
Housing units in structures - 20 to 49 (%)
Housing units in structures - 50 or more (%)
Housing units in structures - Mobile home (%)
Housing units in structures - Boat, RV, van, etc. (%)
House/condo owner moved in on average (years ago)
Renter moved in on average (years ago)
Year householder moved into unit - Moved in 1999 to March 2000 (%)
Year householder moved into unit - Moved in 1995 to 1998 (%)
Year householder moved into unit - Moved in 1990 to 1994 (%)
Year householder moved into unit - Moved in 1980 to 1989 (%)
Year householder moved into unit - Moved in 1970 to 1979 (%)
Year householder moved into unit - Moved in 1969 or earlier (%)
Means of transportation to work - Drove car alone (%)
Means of transportation to work - Carpooled (%)
Means of transportation to work - Public transportation (%)
Means of transportation to work - Bus or trolley bus (%)
Means of transportation to work - Streetcar or trolley car (%)
Means of transportation to work - Subway or elevated (%)
Means of transportation to work - Railroad (%)
Means of transportation to work - Ferryboat (%)
Means of transportation to work - Taxicab (%)
Means of transportation to work - Motorcycle (%)
Means of transportation to work - Bicycle (%)
Means of transportation to work - Walked (%)
Means of transportation to work - Other means (%)
Working at home (%)
Industry diversity
Most Common Industries - Agriculture, forestry, fishing and hunting, and mining (%)
Most Common Industries - Agriculture, forestry, fishing and hunting (%)
Most Common Industries - Mining, quarrying, and oil and gas extraction (%)
Most Common Industries - Construction (%)
Most Common Industries - Manufacturing (%)
Most Common Industries - Wholesale trade (%)
Most Common Industries - Retail trade (%)
Most Common Industries - Transportation and warehousing, and utilities (%)
Most Common Industries - Transportation and warehousing (%)
Most Common Industries - Utilities (%)
Most Common Industries - Information (%)
Most Common Industries - Finance and insurance, and real estate and rental and leasing (%)
Most Common Industries - Finance and insurance (%)
Most Common Industries - Real estate and rental and leasing (%)
Most Common Industries - Professional, scientific, and management, and administrative and waste management services (%)
Most Common Industries - Professional, scientific, and technical services (%)
Most Common Industries - Management of companies and enterprises (%)
Most Common Industries - Administrative and support and waste management services (%)
Most Common Industries - Educational services, and health care and social assistance (%)
Most Common Industries - Educational services (%)
Most Common Industries - Health care and social assistance (%)
Most Common Industries - Arts, entertainment, and recreation, and accommodation and food services (%)
Most Common Industries - Arts, entertainment, and recreation (%)
Most Common Industries - Accommodation and food services (%)
Most Common Industries - Other services, except public administration (%)
Most Common Industries - Public administration (%)
Occupation diversity
Most Common Occupations - Management, business, science, and arts occupations (%)
Most Common Occupations - Management, business, and financial occupations (%)
Most Common Occupations - Management occupations (%)
Most Common Occupations - Business and financial operations occupations (%)
Most Common Occupations - Computer, engineering, and science occupations (%)
Most Common Occupations - Computer and mathematical occupations (%)
Most Common Occupations - Architecture and engineering occupations (%)
Most Common Occupations - Life, physical, and social science occupations (%)
Most Common Occupations - Education, legal, community service, arts, and media occupations (%)
Most Common Occupations - Community and social service occupations (%)
Most Common Occupations - Legal occupations (%)
Most Common Occupations - Education, training, and library occupations (%)
Most Common Occupations - Arts, design, entertainment, sports, and media occupations (%)
Most Common Occupations - Healthcare practitioners and technical occupations (%)
Most Common Occupations - Health diagnosing and treating practitioners and other technical occupations (%)
Most Common Occupations - Health technologists and technicians (%)
Most Common Occupations - Service occupations (%)
Most Common Occupations - Healthcare support occupations (%)
Most Common Occupations - Protective service occupations (%)
Most Common Occupations - Fire fighting and prevention, and other protective service workers including supervisors (%)
Most Common Occupations - Law enforcement workers including supervisors (%)
Most Common Occupations - Food preparation and serving related occupations (%)
Most Common Occupations - Building and grounds cleaning and maintenance occupations (%)
Most Common Occupations - Personal care and service occupations (%)
Most Common Occupations - Sales and office occupations (%)
Most Common Occupations - Sales and related occupations (%)
Most Common Occupations - Office and administrative support occupations (%)
Most Common Occupations - Natural resources, construction, and maintenance occupations (%)
Most Common Occupations - Farming, fishing, and forestry occupations (%)
Most Common Occupations - Construction and extraction occupations (%)
Most Common Occupations - Installation, maintenance, and repair occupations (%)
Most Common Occupations - Production, transportation, and material moving occupations (%)
Most Common Occupations - Production occupations (%)
Most Common Occupations - Transportation occupations (%)
Most Common Occupations - Material moving occupations (%)
People in Group quarters - Institutionalized population (%)
People in Group quarters - Correctional institutions (%)
People in Group quarters - Federal prisons and detention centers (%)
People in Group quarters - Halfway houses (%)
People in Group quarters - Local jails and other confinement facilities (including police lockups) (%)
People in Group quarters - Military disciplinary barracks (%)
People in Group quarters - State prisons (%)
People in Group quarters - Other types of correctional institutions (%)
People in Group quarters - Nursing homes (%)
People in Group quarters - Hospitals/wards, hospices, and schools for the handicapped (%)
People in Group quarters - Hospitals/wards and hospices for chronically ill (%)
People in Group quarters - Hospices or homes for chronically ill (%)
People in Group quarters - Military hospitals or wards for chronically ill (%)
People in Group quarters - Other hospitals or wards for chronically ill (%)
People in Group quarters - Hospitals or wards for drug/alcohol abuse (%)
People in Group quarters - Mental (Psychiatric) hospitals or wards (%)
People in Group quarters - Schools, hospitals, or wards for the mentally retarded (%)
People in Group quarters - Schools, hospitals, or wards for the physically handicapped (%)
People in Group quarters - Institutions for the deaf (%)
People in Group quarters - Institutions for the blind (%)
People in Group quarters - Orthopedic wards and institutions for the physically handicapped (%)
People in Group quarters - Wards in general hospitals for patients who have no usual home elsewhere (%)
People in Group quarters - Wards in military hospitals for patients who have no usual home elsewhere (%)
People in Group quarters - Juvenile institutions (%)
People in Group quarters - Long-term care (%)
People in Group quarters - Homes for abused, dependent, and neglected children (%)
People in Group quarters - Residential treatment centers for emotionally disturbed children (%)
People in Group quarters - Training schools for juvenile delinquents (%)
People in Group quarters - Short-term care, detention or diagnostic centers for delinquent children (%)
People in Group quarters - Type of juvenile institution unknown (%)
People in Group quarters - Noninstitutionalized population (%)
People in Group quarters - College dormitories (includes college quarters off campus) (%)
People in Group quarters - Military quarters (%)
People in Group quarters - On base (%)
People in Group quarters - Barracks, unaccompanied personnel housing (UPH), (Enlisted/Officer), ;and similar group living quarters for military personnel (%)
People in Group quarters - Transient quarters for temporary residents (%)
People in Group quarters - Military ships (%)
People in Group quarters - Group homes (%)
People in Group quarters - Homes or halfway houses for drug/alcohol abuse (%)
People in Group quarters - Homes for the mentally ill (%)
People in Group quarters - Homes for the mentally retarded (%)
People in Group quarters - Homes for the physically handicapped (%)
People in Group quarters - Other group homes (%)
People in Group quarters - Religious group quarters (%)
People in Group quarters - Dormitories (%)
People in Group quarters - Agriculture workers' dormitories on farms (%)
People in Group quarters - Job Corps and vocational training facilities (%)
People in Group quarters - Other workers' dormitories (%)
People in Group quarters - Crews of maritime vessels (%)
People in Group quarters - Other nonhousehold living situations (%)
People in Group quarters - Other noninstitutional group quarters (%)
Residents speaking English at home (%)
Residents speaking English at home - Born in the United States (%)
Residents speaking English at home - Native, born elsewhere (%)
Residents speaking English at home - Foreign born (%)
Residents speaking Spanish at home (%)
Residents speaking Spanish at home - Born in the United States (%)
Residents speaking Spanish at home - Native, born elsewhere (%)
Residents speaking Spanish at home - Foreign born (%)
Residents speaking other language at home (%)
Residents speaking other language at home - Born in the United States (%)
Residents speaking other language at home - Native, born elsewhere (%)
Residents speaking other language at home - Foreign born (%)
Class of Workers - Employee of private company (%)
Class of Workers - Self-employed in own incorporated business (%)
Class of Workers - Private not-for-profit wage and salary workers (%)
Class of Workers - Local government workers (%)
Class of Workers - State government workers (%)
Class of Workers - Federal government workers (%)
Class of Workers - Self-employed workers in own not incorporated business and Unpaid family workers (%)
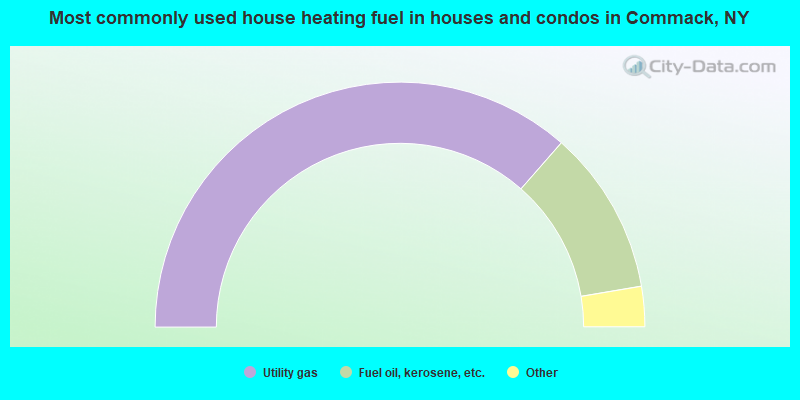
House heating fuel used in houses and condos - Utility gas (%)
House heating fuel used in houses and condos - Bottled, tank, or LP gas (%)
House heating fuel used in houses and condos - Electricity (%)
House heating fuel used in houses and condos - Fuel oil, kerosene, etc. (%)
House heating fuel used in houses and condos - Coal or coke (%)
House heating fuel used in houses and condos - Wood (%)
House heating fuel used in houses and condos - Solar energy (%)
House heating fuel used in houses and condos - Other fuel (%)
House heating fuel used in houses and condos - No fuel used (%)
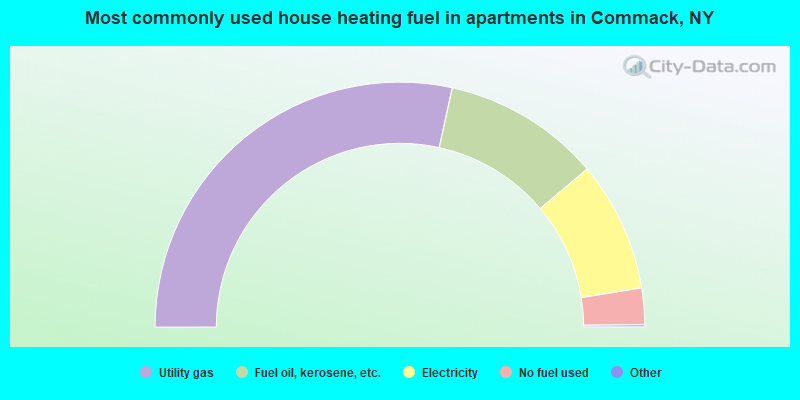
House heating fuel used in apartments - Utility gas (%)
House heating fuel used in apartments - Bottled, tank, or LP gas (%)
House heating fuel used in apartments - Electricity (%)
House heating fuel used in apartments - Fuel oil, kerosene, etc. (%)
House heating fuel used in apartments - Coal or coke (%)
House heating fuel used in apartments - Wood (%)
House heating fuel used in apartments - Solar energy (%)
House heating fuel used in apartments - Other fuel (%)
House heating fuel used in apartments - No fuel used (%)
Armed forces status - In Armed Forces (%)
Armed forces status - Civilian (%)
Armed forces status - Civilian - Veteran (%)
Armed forces status - Civilian - Nonveteran (%)
Read more: https://www.city-data.com/accidents/acc-Addison-Illinois.html
Fatal accidents locations in years 2005-2022
Fatal accidents locations in 2022
Fatal accidents locations in 2021
Fatal accidents locations in 2020
Fatal accidents locations in 2019
Fatal accidents locations in 2018
Fatal accidents locations in 2017
Fatal accidents locations in 2016
Fatal accidents locations in 2015
Fatal accidents locations in 2014
Fatal accidents locations in 2013
Fatal accidents locations in 2012
Fatal accidents locations in 2011
Fatal accidents locations in 2010
Fatal accidents locations in 2009
Fatal accidents locations in 2008
Fatal accidents locations in 2007
Fatal accidents locations in 2006
Fatal accidents locations in 2005
Alcohol use - People drinking some alcohol every month (%)
Alcohol use - People not drinking at all (%)
Alcohol use - Average days/month drinking alcohol
Alcohol use - Average drinks/week
Alcohol use - Average days/year people drink much
Audiometry - Average condition of hearing (%)
Audiometry - People that can hear a whisper from across a quiet room (%)
Audiometry - People that can hear normal voice from across a quiet room (%)
Audiometry - Ears ringing, roaring, buzzing (%)
Audiometry - Had a job exposure to loud noise (%)
Audiometry - Had off-work exposure to loud noise (%)
Blood Pressure & Cholesterol - Has high blood pressure (%)
Blood Pressure & Cholesterol - Checking blood pressure at home (%)
Blood Pressure & Cholesterol - Frequently checking blood cholesterol (%)
Blood Pressure & Cholesterol - Has high cholesterol level (%)
Consumer Behavior - Money monthly spent on food at supermarket/grocery store
Consumer Behavior - Money monthly spent on food at other stores
Consumer Behavior - Money monthly spent on eating out
Consumer Behavior - Money monthly spent on carryout/delivered foods
Consumer Behavior - Income spent on food at supermarket/grocery store (%)
Consumer Behavior - Income spent on food at other stores (%)
Consumer Behavior - Income spent on eating out (%)
Consumer Behavior - Income spent on carryout/delivered foods (%)
Current Health Status - General health condition (%)
Current Health Status - Blood donors (%)
Current Health Status - Has blood ever tested for HIV virus (%)
Current Health Status - Left-handed people (%)
Dermatology - People using sunscreen (%)
Diabetes - Diabetics (%)
Diabetes - Had a blood test for high blood sugar (%)
Diabetes - People taking insulin (%)
Diet Behavior & Nutrition - Diet health (%)
Diet Behavior & Nutrition - Milk product consumption (# of products/month)
Diet Behavior & Nutrition - Meals not home prepared (#/week)
Diet Behavior & Nutrition - Meals from fast food or pizza place (#/week)
Diet Behavior & Nutrition - Ready-to-eat foods (#/month)
Diet Behavior & Nutrition - Frozen meals/pizza (#/month)
Drug Use - People that ever used marijuana or hashish (%)
Drug Use - Ever used hard drugs (%)
Drug Use - Ever used any form of cocaine (%)
Drug Use - Ever used heroin (%)
Drug Use - Ever used methamphetamine (%)
Health Insurance - People covered by health insurance (%)
Kidney Conditions-Urology - Avg. # of times urinating at night
Medical Conditions - People with asthma (%)
Medical Conditions - People with anemia (%)
Medical Conditions - People with psoriasis (%)
Medical Conditions - People with overweight (%)
Medical Conditions - Elderly people having difficulties in thinking or remembering (%)
Medical Conditions - People who ever received blood transfusion (%)
Medical Conditions - People having trouble seeing even with glass/contacts (%)
Medical Conditions - People with arthritis (%)
Medical Conditions - People with gout (%)
Medical Conditions - People with congestive heart failure (%)
Medical Conditions - People with coronary heart disease (%)
Medical Conditions - People with angina pectoris (%)
Medical Conditions - People who ever had heart attack (%)
Medical Conditions - People who ever had stroke (%)
Medical Conditions - People with emphysema (%)
Medical Conditions - People with thyroid problem (%)
Medical Conditions - People with chronic bronchitis (%)
Medical Conditions - People with any liver condition (%)
Medical Conditions - People who ever had cancer or malignancy (%)
Mental Health - People who have little interest in doing things (%)
Mental Health - People feeling down, depressed, or hopeless (%)
Mental Health - People who have trouble sleeping or sleeping too much (%)
Mental Health - People feeling tired or having little energy (%)
Mental Health - People with poor appetite or overeating (%)
Mental Health - People feeling bad about themself (%)
Mental Health - People who have trouble concentrating on things (%)
Mental Health - People moving or speaking slowly or too fast (%)
Mental Health - People having thoughts they would be better off dead (%)
Oral Health - Average years since last visit a dentist
Oral Health - People embarrassed because of mouth (%)
Oral Health - People with gum disease (%)
Oral Health - General health of teeth and gums (%)
Oral Health - Average days a week using dental floss/device
Oral Health - Average days a week using mouthwash for dental problem
Oral Health - Average number of teeth
Pesticide Use - Households using pesticides to control insects (%)
Pesticide Use - Households using pesticides to kill weeds (%)
Physical Activity - People doing vigorous-intensity work activities (%)
Physical Activity - People doing moderate-intensity work activities (%)
Physical Activity - People walking or bicycling (%)
Physical Activity - People doing vigorous-intensity recreational activities (%)
Physical Activity - People doing moderate-intensity recreational activities (%)
Physical Activity - Average hours a day doing sedentary activities
Physical Activity - Average hours a day watching TV or videos
Physical Activity - Average hours a day using computer
Physical Functioning - People having limitations keeping them from working (%)
Physical Functioning - People limited in amount of work they can do (%)
Physical Functioning - People that need special equipment to walk (%)
Physical Functioning - People experiencing confusion/memory problems (%)
Physical Functioning - People requiring special healthcare equipment (%)
Prescription Medications - Average number of prescription medicines taking
Preventive Aspirin Use - Adults 40+ taking low-dose aspirin (%)
Reproductive Health - Vaginal deliveries (%)
Reproductive Health - Cesarean deliveries (%)
Reproductive Health - Deliveries resulted in a live birth (%)
Reproductive Health - Pregnancies resulted in a delivery (%)
Reproductive Health - Women breastfeeding newborns (%)
Reproductive Health - Women that had a hysterectomy (%)
Reproductive Health - Women that had both ovaries removed (%)
Reproductive Health - Women that have ever taken birth control pills (%)
Reproductive Health - Women taking birth control pills (%)
Reproductive Health - Women that have ever used Depo-Provera or injectables (%)
Reproductive Health - Women that have ever used female hormones (%)
Sexual Behavior - People 18+ that ever had sex (vaginal, anal, or oral) (%)
Sexual Behavior - Males 18+ that ever had vaginal sex with a woman (%)
Sexual Behavior - Males 18+ that ever performed oral sex on a woman (%)
Sexual Behavior - Males 18+ that ever had anal sex with a woman (%)
Sexual Behavior - Males 18+ that ever had any sex with a man (%)
Sexual Behavior - Females 18+ that ever had vaginal sex with a man (%)
Sexual Behavior - Females 18+ that ever performed oral sex on a man (%)
Sexual Behavior - Females 18+ that ever had anal sex with a man (%)
Sexual Behavior - Females 18+ that ever had any kind of sex with a woman (%)
Sexual Behavior - Average age people first had sex
Sexual Behavior - Average number of female sex partners in lifetime (males 18+)
Sexual Behavior - Average number of female vaginal sex partners in lifetime (males 18+)
Sexual Behavior - Average age people first performed oral sex on a woman (18+)
Sexual Behavior - Average number of woman performed oral sex on in lifetime (18+)
Sexual Behavior - Average number of male sex partners in lifetime (males 18+)
Sexual Behavior - Average number of male anal sex partners in lifetime (males 18+)
Sexual Behavior - Average age people first performed oral sex on a man (18+)
Sexual Behavior - Average number of male oral sex partners in lifetime (18+)
Sexual Behavior - People using protection when performing oral sex (%)
Sexual Behavior - Average number of times people have vaginal or anal sex a year
Sexual Behavior - People having sex without condom (%)
Sexual Behavior - Average number of male sex partners in lifetime (females 18+)
Sexual Behavior - Average number of male vaginal sex partners in lifetime (females 18+)
Sexual Behavior - Average number of female sex partners in lifetime (females 18+)
Sexual Behavior - Circumcised males 18+ (%)
Sleep Disorders - Average hours sleeping at night
Sleep Disorders - People that has trouble sleeping (%)
Smoking-Cigarette Use - People smoking cigarettes (%)
Taste & Smell - People 40+ having problems with smell (%)
Taste & Smell - People 40+ having problems with taste (%)
Taste & Smell - People 40+ that ever had wisdom teeth removed (%)
Taste & Smell - People 40+ that ever had tonsils teeth removed (%)
Taste & Smell - People 40+ that ever had a loss of consciousness because of a head injury (%)
Taste & Smell - People 40+ that ever had a broken nose or other serious injury to face or skull (%)
Taste & Smell - People 40+ that ever had two or more sinus infections (%)
Weight - Average height (inches)
Weight - Average weight (pounds)
Weight - Average BMI
Weight - People that are obese (%)
Weight - People that ever were obese (%)
Weight - People trying to lose weight (%)
According to our research of New York and other state lists, there were 5 registered sex offenders living in Commack, New York as of April 28, 2025 . The ratio of all residents to sex offenders in Commack is 7,298 to 1.The ratio of registered sex offenders to all residents in this city is much lower than the state average.
Latest news from Commack, NY collected exclusively by city-data.com from local newspapers, TV, and radio stations
Ancestries: Italian (25.4%), American (10.3%), Irish (9.2%), German (4.9%), European (3.9%), Eastern European (3.7%).
Current Local Time:
Land area: 12.1 square miles.
Population density: 2,995 people per square mile (average).
3,779 residents are foreign born (4.2% Asia , 3.3% Europe , 2.2% Latin America ).
This place:
10.4%New York:
22.6%
Median real estate property taxes paid for housing units with mortgages in 2023: $10,001 (1.4%)Median real estate property taxes paid for housing units with no mortgage in 2023: $9,969 (1.5%)
Nearest city with pop. 50,000+: Brentwood, NY
Nearest city with pop. 200,000+: North Hempstead, NY
Nearest city with pop. 1,000,000+: Queens, NY
Nearest cities:
Latitude: 40.85 N, Longitude: 73.28 W
Daytime population change due to commuting: -1,427 (-3.9%)Workers who live and work in this place: 4,748 (25.5%)
Unemployment in November 2024:
Most common occupations in Commack, NY (%)
Both Males Females
Sales representatives, services, wholesale and manufacturing (5.3%)
Preschool, kindergarten, elementary, and middle school teachers (4.6%)
Other office and administrative support workers, including supervisors (4.5%)
Other management occupations, except farmers and farm managers (4.4%)
Secretaries and administrative assistants (4.3%)
Other sales and related occupations, including supervisors (4.0%)
Retail sales workers, except cashiers (3.7%)
Sales representatives, services, wholesale and manufacturing (7.0%)
Other management occupations, except farmers and farm managers (5.2%)
Top executives (4.5%)
Other sales and related occupations, including supervisors (4.4%)
Computer specialists (4.3%)
Engineers (4.1%)
Law enforcement workers, including supervisors (4.0%)
Secretaries and administrative assistants (9.4%)
Preschool, kindergarten, elementary, and middle school teachers (8.3%)
Other office and administrative support workers, including supervisors (7.3%)
Registered nurses (4.8%)
Other teachers, instructors, education, training, and library occupations (4.7%)
Retail sales workers, except cashiers (4.1%)
Bookkeeping, accounting, and auditing clerks (3.5%)
Tornado activity:
Commack-area historical tornado activity is slightly above New York state average. It is 54% smaller than the overall U.S. average.
On 7/10/1989, a category F4 (max. wind speeds 207-260 mph) tornado 37.9 miles away from the Commack place center injured 40 people and caused between $50,000,000 and $500,000,000 in damages.
On 9/18/1973, a category F2 (max. wind speeds 113-157 mph) tornado 14.9 miles away from the place center .
Earthquake activity:
Commack-area historical earthquake activity is significantly above New York state average. It is 71% smaller than the overall U.S. average. On 10/7/1983 at 10:18:46, a magnitude 5.3 (5.1 MB, 5.3 LG, 5.1 ML, Class: Moderate, Intensity: VI - VII) earthquake occurred 221.7 miles away from Commack center On 8/23/2011 at 17:51:04, a magnitude 5.8 (5.8 MW, Depth: 3.7 mi) earthquake occurred 321.0 miles away from the city center On 4/20/2002 at 10:50:47, a magnitude 5.3 (5.3 ML, Depth: 3.0 mi) earthquake occurred 254.5 miles away from Commack center On 4/20/2002 at 10:50:47, a magnitude 5.2 (5.2 MB, 4.2 MS, 5.2 MW, 5.0 MW) earthquake occurred 252.9 miles away from Commack center On 1/16/1994 at 01:49:16, a magnitude 4.6 (4.6 MB, 4.6 LG, Depth: 3.1 mi, Class: Light, Intensity: IV - V) earthquake occurred 149.0 miles away from the city center On 8/22/1992 at 12:20:32, a magnitude 4.8 (4.8 MB, 3.8 MS, 4.7 LG, Depth: 6.2 mi) earthquake occurred 197.9 miles away from the city center Magnitude types: regional Lg-wave magnitude (LG), body-wave magnitude (MB), local magnitude (ML), surface-wave magnitude (MS), moment magnitude (MW) Natural disasters: The number of natural disasters in Suffolk County (35) is a lot greater than the US average (19).Major Disasters (Presidential) Declared: 19Emergencies Declared: 7Hurricanes: 12, Floods: 9, Storms: 9, Snowstorms: 5, Winter Storms: 4, Blizzards: 2, Heavy Rain: 1, Power Outage: 1, Tropical Depression: 1, Tropical Storm: 1, Water Shortage: 1, Other: 4 (Note: some incidents may be assigned to more than one category). Hospitals and medical centers in Commack: UCPA OF GREATER SUFFOLK (159 INDIAN HEAD RD) GURWIN JEWISH NURSING AND REHABILITATION CENTER (68 HAUPPAUGE ROAD)
ISLAND REHABILITATIVE SERVICES - COMMACK (68 HAUPPAUGE ROAD)
GURWIN JEWISH NRSG AND REHAB CENTER LTHHCP (5036 JERICHO TURNPIKE SUITE 202)
HEALTH SERVICES AT HOME CHHA (2171 JERICHO TURNPIKE)
Amtrak station near Commack: 20 miles: STAMFORD (WASHINGTON BLVD. & E. STATE ST.) Services: ticket office, fully wheelchair accessible, enclosed waiting area, public restrooms, public payphones, snack bar, ATM, paid short-term parking, paid long-term parking, call for car rental service, taxi stand, public transit connection.
Colleges/universities with over 2000 students nearest to Commack:
Dowling College (about 10 miles; Oakdale, NY ; Full-time enrollment: 2,598)
Stony Brook University (about 10 miles; Stony Brook, NY ; FT enrollment: 22,071)
Farmingdale State College (about 10 miles; Farmingdale, NY ; FT enrollment: 6,956)
Suffolk County Community College (about 12 miles; Selden, NY ; FT enrollment: 18,540)
Briarcliffe College (about 13 miles; Bethpage, NY ; FT enrollment: 2,134)
SUNY College at Old Westbury (about 16 miles; Old Westbury, NY ; FT enrollment: 4,096)
LIU Post (about 17 miles; Brookville, NY ; FT enrollment: 6,854)
Public high school in Commack:
Public elementary/middle schools in Commack: COMMACK MIDDLE SCHOOL Students: 1,908, Location: 700 VANDERBILT PKY, Grades: 6-8)BURR INTERMEDIATE SCHOOL Students: 982, Location: BURR RD, Grades: 3-5)SAWMILL INTERMEDIATE SCHOOL Students: 765, Location: 103 NEW HWY, Grades: 3-5)WOOD PARK SCHOOL Students: 461, Location: 15 NEW HWY, Grades: KG-2)NORTH RIDGE SCHOOL Students: 458, Location: 300 TOWNLINE RD, Grades: KG-2)INDIAN HOLLOW SCHOOL Students: 355, Location: 151 KINGS PARK RD, Grades: KG-2)Private elementary/middle school in Commack:
See full list of schools located in Commack Library in Commack: COMMACK PUBLIC LIBRARY DISTRICT Operating income: $3,205,189; Location: 18 HAUPPAUGE ROAD; 137,219 books ; 4,881 e-books ; 11,101 audio materials ; 5,873 video materials ; 42 local licensed databases ; 14 state licensed databases ; 472 print serial subscriptions ; 3 electronic serial subscriptions )
Notable locations in Commack: (A) , Bishop McConnel Day Camp (B) , Commack Public Library (C) , Smithtown Library Commack Branch (D) , Gurwin Jewish Nursing and Rehabilitation Center (E) , Commack Fire Department (F) . Display/hide their locations on the map
Churches in Commack include: (A) , Evangelical Covenant Church (B) , Holy Cross Lutheran Church (C) , Long Island Korean Methodist Church (D) , Commack Jewish Center (E) , Commack Church of God (F) , Commack Church of Christ (G) , Christ The King Catholic Church (H) , Chabad Center of Mid Suffolk (I) . Display/hide their locations on the map
Cemeteries: (1) , Holy Cross Cemetery (2) . Display/hide their locations on the map
Parks in Commack include: (1) , Sunshine Acres Park (2) , Cedar Road Park (3) , Wicks Park (4) , Burr-Winkle Park (5) , Valmont Village Park (6) . Display/hide their locations on the map
Birthplace of: Rosie O'Donnell - (born 1962), actress, comedian and talk show host, John Macaluso - Drummer, Brian Piesner - Soccer player, Michael Belfiore (baseball) - Professional baseball player, Pete Harnisch - Baseball player, Samantha Prahalis - Basketball player.
Suffolk County has a predicted average indoor radon screening level less than 2 pCi/L (pico curies per liter) - Low Potential Average household size: This place:
3.0 peopleNew York:
2.6 people
Percentage of family households: This place:
83.1%Whole state:
63.5%
Percentage of households with unmarried partners: This place:
2.6%Whole state:
6.8%
Likely homosexual households (counted as self-reported same-sex unmarried-partner households)
Lesbian couples: 0.2% of all households Gay men: 0.2% of all households
People in group quarters in Commack in 2010:
419 people in nursing facilities/skilled-nursing facilities
75 people in group homes intended for adults
12 people in other noninstitutional facilities
People in group quarters in Commack in 2000:
445 people in nursing homes
75 people in homes for the mentally retarded
13 people in religious group quarters
8 people in homes for the mentally ill
Banks with most branches in Commack (2011 data):
JPMorgan Chase Bank, National Association: Commack Corners Banking Center, Commack Branch, Commack Branch. Info updated 2011/11/10: Bank assets: $1,811,678.0 mil, Deposits: $1,190,738.0 mil, headquarters in Columbus, OH, positive income , International Specialization, 5577 total offices , Holding Company: Jpmorgan Chase & Co.
Citibank, National Association: Cbc Site - Dix Hills Branch at 18 Vanderbilt Parkway, branch established on 2000/07/01; Commack Branch at 6105 Jericho Turnpike, branch established on 1979/08/17. Info updated 2012/01/10: Bank assets: $1,288,658.0 mil, Deposits: $882,541.0 mil, headquarters in Sioux Falls, SD, positive income , International Specialization, 1048 total offices , Holding Company: Citigroup Inc.
Capital One, National Association: Commack Branch at 2050 Jericho Turnpike, branch established on 1976/03/27; Commack West Branch at 6080 Jericho Turnpike, branch established on 1993/09/07. Info updated 2011/07/01: Bank assets: $133,477.8 mil, Deposits: $97,063.7 mil, headquarters in Mclean, VA, positive income , 984 total offices , Holding Company: Capital One Financial Corporation
People's United Bank: Commack Branch at 2020 Jericho Turnpike, branch established on 1910/01/01. Info updated 2012/02/16: Bank assets: $27,319.3 mil, Deposits: $20,835.4 mil, headquarters in Bridgeport, CT, positive income , Commercial Lending Specialization, 374 total offices
TD Bank, National Association: Commack Branch at 6190 Jericho Turnpike, branch established on 2003/11/01. Info updated 2010/10/04: Bank assets: $188,912.6 mil, Deposits: $153,149.8 mil, headquarters in Wilmington, DE, positive income , 1314 total offices , Holding Company: Toronto-Dominion Bank, The
HSBC Bank USA, National Association: Commack Branch at 5880 Jericho Turnpike, branch established on 1978/03/31. Info updated 2010/11/30: Bank assets: $206,009.7 mil, Deposits: $149,026.8 mil, headquarters in Mc Lean, VA, positive income , 474 total offices , Holding Company: Hsbc Holdings Plc
Investors Bank: Commack Branch at 1174 Jericho Turnpike, branch established on 2008/04/30. Info updated 2012/02/27: Bank assets: $10,674.9 mil, Deposits: $7,419.7 mil, headquarters in Short Hills, NJ, positive income , Commercial Lending Specialization, 86 total offices , Holding Company: Investors Bancorp, Mhc
Apple Bank for Savings: Commack Branch at 41 Commack Road, branch established on 1971/06/12. Info updated 2006/11/03: Bank assets: $7,582.2 mil, Deposits: $6,688.3 mil, headquarters in Manhasset, NY, positive income , Commercial Lending Specialization, 51 total offices , Holding Company: Apple Financial Holdings, Inc.
American Community Bank: Commack Branch at 100 Commack Road, branch established on 2005/01/10. Info updated 2009/07/01: Bank assets: $156.6 mil, Deposits: $129.4 mil, headquarters in Glen Cove, NY, positive income , Commercial Lending Specialization, 4 total offices , Holding Company: American Community Bancorp, Inc.
2 other banks with 2 local branches
For population 15 years and over in Commack:
Never married: 29.3%Now married: 59.6%Separated: 0.2%Widowed: 5.2%Divorced: 5.8% For population 25 years and over in Commack:
High school or higher: 96.7%Bachelor's degree or higher: 59.5%Graduate or professional degree: 28.6%Unemployed: 2.9%Mean travel time to work (commute): 29.2 minutes
Education Gini index (Inequality in education) Here:
9.6New York average:
13.8
Religion statistics for Commack, NY (based on Suffolk County data)
Religion Adherents Congregations Catholic 879,457 75 Mainline Protestant 69,205 182 Evangelical Protestant 58,909 264 Other 50,771 124 Orthodox 10,190 10 Black Protestant 8,298 49 None 416,520 -
Source: Clifford Grammich, Kirk Hadaway, Richard Houseal, Dale E.Jones, Alexei Krindatch, Richie Stanley and Richard H.Taylor. 2012. 2010 U.S.Religion Census: Religious Congregations & Membership Study. Association of Statisticians of American Religious Bodies. Jones, Dale E., et al. 2002. Congregations and Membership in the United States 2000. Nashville, TN: Glenmary Research Center. Graphs represent county-level data
Food Environment Statistics: Number of grocery stores : 514This county :
3.40 / 10,000 pop.New York :
4.13 / 10,000 pop.
Number of supercenters and club stores : 9Suffolk County :
0.06 / 10,000 pop.New York :
0.06 / 10,000 pop.
Number of convenience stores (no gas) : 217Suffolk County :
1.44 / 10,000 pop.New York :
0.92 / 10,000 pop.
Number of convenience stores (with gas) : 256This county :
1.69 / 10,000 pop.New York :
1.68 / 10,000 pop.
Number of full-service restaurants : 1,232Suffolk County :
8.15 / 10,000 pop.New York :
8.82 / 10,000 pop.
Adult diabetes rate : This county :
8.1%State :
8.2%
Adult obesity rate : Suffolk County :
23.4%State :
23.8%
Low-income preschool obesity rate : Health and Nutrition: Healthy diet rate : Commack:
55.3%New York:
50.1%
Average overall health of teeth and gums : Average BMI : Commack:
28.1New York:
28.5
People feeling badly about themselves : People not drinking alcohol at all : Average hours sleeping at night : General health condition : Average condition of hearing : Commack:
80.1%New York:
80.2%
More about Health and Nutrition of Commack, NY Residents
4.14% of this county's 2021 resident taxpayers lived in other counties in 2020 ($206,656 average adjusted gross income )
Here:
4.14%New York average:
5.29%
0.01% of residents moved from foreign countries ($74 average AGI )Suffolk County:
0.01%New York average:
0.01%
Top counties from which taxpayers relocated into this county between 2020 and 2021:
4.28% of this county's 2020 resident taxpayers moved to other counties in 2021 ($141,172 average adjusted gross income )
Here:
4.28%New York average:
6.93%
0.01% of residents moved to foreign countries ($169 average AGI )Suffolk County:
0.01%New York average:
0.02%
Top counties to which taxpayers relocated from this county between 2020 and 2021:
Businesses in Commack, NY
Name Count Name Count
7-Eleven 3 McDonald's 1 AMF Bowling 1 Motherhood Maternity 2 AT&T 3 New Balance 1 Ace Hardware 1 New York & Co 1 Advance Auto Parts 1 Nike 4 Ann Taylor 1 Old Navy 1 Applebee's 1 Outback 1 Baskin-Robbins 3 Outback Steakhouse 1 Blockbuster 1 Payless 1 Burger King 1 PetSmart 1 CVS 1 Pier 1 Imports 1 Chuck E. Cheese's 1 Quiznos 1 Costco 1 RadioShack 1 Dunkin Donuts 5 Ruby Tuesday 1 Famous Footwear 1 SAS Shoes 1 FedEx 7 Sprint Nextel 1 GNC 1 Staples 1 GameStop 2 Starbucks 2 Gap 1 Subway 3 Goodwill 2 T-Mobile 6 Harmon Face Values 1 Taco Bell 1 Hilton 1 Talbots 1 Home Depot 2 Target 2 IHOP 1 Toys"R"Us 2 JoS. A. Bank 1 Trader Joe's 1 Jones New York 2 UPS 7 Justice 1 Waldbaums 1 KFC 1 Walgreens 1 Kohl's 1 Walmart 1 Macy's 1 Wendy's 1 Marshalls 1
Strongest AM radio stations in Commack:
WGSM (740 AM; 25 kW; HUNTINGTON, NY; Owner: K RADIO LICENSEE, INC.)
WFAN (660 AM; 50 kW; NEW YORK, NY; Owner: INFINITY BROADCASTING OPERATIONS, INC.)
WCBS (880 AM; 50 kW; NEW YORK, NY; Owner: INFINITY BROADCASTING OPERATIONS, INC.)
WLIE (540 AM; 2 kW; ISLIP, NY; Owner: LONG ISLAND MULTIMEDIA, LLC.)
WMCA (570 AM; 50 kW; NEW YORK, NY; Owner: SALEM MEDIA OF NEW YORK, LLC)
WOR (710 AM; 50 kW; NEW YORK, NY; Owner: BUCKLEY BROADCASTING CORPORATION)
WABC (770 AM; 50 kW; NEW YORK, NY; Owner: WABC-AM RADIO, INC.)
WBBR (1130 AM; 50 kW; NEW YORK, NY; Owner: BLOOMBERG COMMUNICATIONS INC.)
WEPN (1050 AM; 50 kW; NEW YORK, NY; Owner: NEW YORK AM RADIO, LLC)
WQEW (1560 AM; 50 kW; NEW YORK, NY; Owner: THE NEW YORK TIMES ELECTRONIC MEDIA COMPANY)
WLIM (1580 AM; 10 kW; PATCHOGUE, NY; Owner: POLNET COMMUNICATIONS, LTD.)
WINS (1010 AM; 50 kW; NEW YORK, NY; Owner: INFINITY BROADCASTING OPERATIONS, INC.)
WADO (1280 AM; 50 kW; NEW YORK, NY; Owner: WADO-AM LICENSE CORP.)
Strongest FM radio stations in Commack:
WMJC (94.3 FM; SMITHTOWN, NY; Owner: IW LIMITED LIABILITY COMPANY)
WBAB (102.3 FM; BABYLON, NY; Owner: CXR HOLDINGS, INC.)
WFRS (88.9 FM; SMITHTOWN, NY; Owner: FAMILY STATIONS, INC.)
W217AF (91.3 FM; HUNTINGTON STATION, NY; Owner: SACRED HEART UNIVERSITY, INC.)
WALK-FM (97.5 FM; PATCHOGUE, NY; Owner: AMFM RADIO LICENSES, L.L.C.)
WBZO (103.1 FM; BAY SHORE, NY; Owner: MID-ISLAND BROADCASTING LIMITED PARTNERSHIP)
WUSB (90.1 FM; STONY BROOK, NY; Owner: STATE UNIVERSITY OF NEW YORK)
WBLI (106.1 FM; PATCHOGUE, NY; Owner: CXR HOLDINGS, INC.)
W289AD (105.7 FM; SELDEN, NY; Owner: SACRED HEART UNIVERSITY, INC.)
WKWZ (88.5 FM; SYOSSET, NY; Owner: SYOSSET CENTRAL SCHOOL DISTRICT)
WPOB (88.5 FM; PLAINVIEW, NY; Owner: PLAINVIEW-OLD BETHPAGE CENT SCH DIST)
WKCR-FM (89.9 FM; NEW YORK, NY; Owner: TRUSTEES OF COLUMBIA UNIVERSITY IN NEW YORK)
WPLJ (95.5 FM; NEW YORK, NY; Owner: WPLJ-FM RADIO, INC.)
WKTU (103.5 FM; LAKE SUCCESS, NY; Owner: AMFM RADIO LICENSES, LLC)
WQCD (101.9 FM; NEW YORK, NY; Owner: EMMIS RADIO LICENSE CORPORATION)
WCAA (105.9 FM; NEWARK, NJ; Owner: WADO-AM LICENSE CORP. ("WADO"))
WAXQ (104.3 FM; NEW YORK, NY; Owner: AMFM NEW YORK LICENSES, LLC)
WHTZ (100.3 FM; NEWARK, NJ; Owner: AMFM RADIO LICENSES, L.L.C.)
WWPR-FM (105.1 FM; NEW YORK, NY; Owner: AMFM RADIO LICENSES, L.L.C.)
WBAI (99.5 FM; NEW YORK, NY; Owner: PACIFICA FOUNDATION, INC.)
TV broadcast stations around Commack:
WNYW (Channel 5; NEW YORK, NY; Owner: FOX TELEVISION STATIONS, INC.)
WCBS-TV (Channel 2; NEW YORK, NY; Owner: CBS BROADCASTING INC.)
WABC-TV (Channel 7; NEW YORK, NY; Owner: AMERICAN BROADCASTING COMPANIES, INC)
WPIX (Channel 11; NEW YORK, NY; Owner: WPIX, INC.)
WWOR-TV (Channel 9; SECAUCUS, NJ; Owner: FOX TELEVISION STATIONS, INC.)
WFTY (Channel 67; SMITHTOWN, NY; Owner: UNIVISION NEW YORK LLC)
WLIW (Channel 21; GARDEN CITY, NY; Owner: EDUCATIONAL BROADCASTING CORPORATION)
WXNY-LP (Channel 32; NEW YORK, NY; Owner: ISLAND BROADCASTING COMPANY)
WNJU (Channel 47; LINDEN, NJ; Owner: WNJU LICENSE CORPORATION)
WPXN-TV (Channel 31; NEW YORK, NY; Owner: PAXSON COMMUNICATIONS LICENSE COMPANY, LLC)
WLNY (Channel 55; RIVERHEAD, NY; Owner: WLNY-TV, INC.)
WFUT (Channel 68; NEWARK, NJ; Owner: UNIVISION NEW YORK LLC)
WNBC (Channel 4; NEW YORK, NY; Owner: NATIONAL BROADCASTING COMPANY, INC.)
WNET (Channel 13; NEWARK, NJ; Owner: EDUCATIONAL BROADCASTING CORPORATION)
WXTV (Channel 41; PATERSON, NJ; Owner: WXTV LICENSE PARTNERSHIP, G.P.)
WNYE-TV (Channel 25; NEW YORK, NY; Owner: NEW YORK CITY BOARD OF EDUCATION)
WKOB-LP (Channel 53; NEW YORK, NY; Owner: WKOB COMMUNICATIONS, INC.)
WEBR-CA (Channel 17; MANHATTAN, NY; Owner: K LICENSEE INC.)
WRNN-LP (Channel 57; NYACK, NY; Owner: LP NYACK LIMITED PARTNERSHIP)
W60AI (Channel 60; NEW YORK, NY; Owner: VENTANA TELEVISION, INC.)
W27CB (Channel 27; HEMPSTEAD, NY; Owner: K LICENSEE INC.)
W38CL (Channel 38; BRONX, NY; Owner: RENARD COMMUNICATIONS CORP.)
W68DN (Channel 68; CHERRY HILL, ETC., NJ; Owner: MARCIA COHEN)
WNYX-LP (Channel 35; NEW YORK, NY; Owner: ISLAND BROADCASTING COMPANY)
W33BS (Channel 33; DARIEN, CT; Owner: CT&T BROADCASTING, INC.)
FCC Registered Antenna Towers: 9 (
See the full list of FCC Registered Antenna Towers in Commack )
FCC Registered Broadcast Land Mobile Towers: 10 (
See the full list of FCC Registered Broadcast Land Mobile Towers in Commack, NY )
FCC Registered Microwave Towers: 1
STATION, Pilgrim Substation (Lat: 40.830917 Lon: -73.287056), Structure height: 30.5 m, Call Sign: KQQ46, Assigned Frequencies: 6845.00 MHz, Grant Date: 06/06/2018, Expiration Date: 07/12/2028, Registrant: Utilities Technology Council, 1129 20th Street Nw, Suite 350, Washington, DC 20036, Phone: (202) 872-0030, Fax: (202) 872-1331, Email:
FCC Registered Amateur Radio Licenses: 129 (
See the full list of FCC Registered Amateur Radio Licenses in Commack )
FAA Registered Aircraft: 11 (
See the full list of FAA Registered Aircraft in Commack )
Home Mortgage Disclosure Act Aggregated Statistics For Year 2009(Based on 9 full and 1 partial tracts) A) FHA, FSA/RHS & VA B) Conventional C) Refinancings D) Home Improvement Loans F) Non-occupant Loans on Number Average Value Number Average Value Number Average Value Number Average Value Number Average Value
LOANS ORIGINATED 51 $405,479 176 $331,801 575 $288,095 37 $179,843 3 $282,333 APPLICATIONS APPROVED, NOT ACCEPTED 1 $314,000 12 $355,655 81 $329,404 4 $89,750 3 $211,667 APPLICATIONS DENIED 13 $353,671 23 $375,771 214 $327,374 16 $64,618 6 $252,852 APPLICATIONS WITHDRAWN 7 $399,930 14 $350,971 158 $312,415 9 $116,108 4 $173,008 FILES CLOSED FOR INCOMPLETENESS 1 $372,000 4 $320,092 43 $301,110 8 $168,704 1 $305,000
Aggregated Statistics For Year 2008(Based on 9 full and 1 partial tracts) A) FHA, FSA/RHS & VA B) Conventional C) Refinancings D) Home Improvement Loans F) Non-occupant Loans on Number Average Value Number Average Value Number Average Value Number Average Value Number Average Value
LOANS ORIGINATED 12 $415,226 193 $349,354 230 $277,802 66 $124,955 5 $340,800 APPLICATIONS APPROVED, NOT ACCEPTED 1 $407,000 23 $376,692 86 $299,088 16 $180,882 2 $201,680 APPLICATIONS DENIED 6 $450,833 41 $399,998 155 $315,167 43 $116,127 5 $399,860 APPLICATIONS WITHDRAWN 1 $512,000 34 $344,894 81 $325,758 11 $130,929 1 $385,000 FILES CLOSED FOR INCOMPLETENESS 0 $0 14 $333,889 24 $296,908 9 $176,373 1 $360,000
Aggregated Statistics For Year 2007(Based on 9 full and 1 partial tracts) A) FHA, FSA/RHS & VA B) Conventional C) Refinancings D) Home Improvement Loans E) Loans on Dwellings For 5+ Families F) Non-occupant Loans on Number Average Value Number Average Value Number Average Value Number Average Value Number Average Value Number Average Value
LOANS ORIGINATED 2 $346,000 323 $314,357 415 $256,861 118 $122,719 2 $200,000 17 $299,653 APPLICATIONS APPROVED, NOT ACCEPTED 0 $0 50 $313,951 94 $251,083 30 $100,471 0 $0 3 $365,333 APPLICATIONS DENIED 0 $0 89 $360,535 239 $340,870 48 $81,891 1 $1,200,000 10 $206,801 APPLICATIONS WITHDRAWN 1 $342,000 48 $328,151 101 $312,870 10 $275,000 0 $0 0 $0 FILES CLOSED FOR INCOMPLETENESS 2 $254,000 22 $408,559 56 $322,730 8 $159,625 0 $0 1 $277,740
Aggregated Statistics For Year 2006(Based on 9 full and 1 partial tracts) B) Conventional C) Refinancings D) Home Improvement Loans E) Loans on Dwellings For 5+ Families F) Non-occupant Loans on G) Loans On Manufactured Number Average Value Number Average Value Number Average Value Number Average Value Number Average Value Number Average Value
LOANS ORIGINATED 374 $324,257 570 $263,509 137 $109,829 0 $0 17 $300,049 1 $42,310 APPLICATIONS APPROVED, NOT ACCEPTED 73 $281,272 124 $255,837 28 $95,093 1 $499,000 6 $372,000 1 $40,000 APPLICATIONS DENIED 114 $329,893 294 $317,712 50 $151,450 0 $0 7 $452,934 1 $80,000 APPLICATIONS WITHDRAWN 42 $294,048 205 $288,578 18 $169,485 0 $0 7 $305,000 0 $0 FILES CLOSED FOR INCOMPLETENESS 18 $350,111 114 $322,667 11 $122,599 0 $0 2 $321,000 0 $0
Aggregated Statistics For Year 2005(Based on 9 full and 1 partial tracts) B) Conventional C) Refinancings D) Home Improvement Loans F) Non-occupant Loans on G) Loans On Manufactured Number Average Value Number Average Value Number Average Value Number Average Value Number Average Value
LOANS ORIGINATED 444 $318,269 631 $265,629 123 $132,446 21 $282,197 0 $0 APPLICATIONS APPROVED, NOT ACCEPTED 60 $320,336 105 $264,914 24 $78,257 1 $350,000 0 $0 APPLICATIONS DENIED 87 $341,408 245 $320,730 62 $133,938 11 $396,124 1 $34,120 APPLICATIONS WITHDRAWN 47 $325,234 262 $267,040 28 $196,783 10 $267,392 0 $0 FILES CLOSED FOR INCOMPLETENESS 28 $299,143 138 $296,504 4 $113,500 1 $440,000 0 $0
Aggregated Statistics For Year 2004(Based on 9 full and 1 partial tracts) A) FHA, FSA/RHS & VA B) Conventional C) Refinancings D) Home Improvement Loans E) Loans on Dwellings For 5+ Families F) Non-occupant Loans on G) Loans On Manufactured Number Average Value Number Average Value Number Average Value Number Average Value Number Average Value Number Average Value Number Average Value
LOANS ORIGINATED 0 $0 437 $302,265 724 $239,384 168 $109,098 0 $0 21 $268,419 0 $0 APPLICATIONS APPROVED, NOT ACCEPTED 1 $189,000 54 $314,949 143 $241,373 41 $98,923 0 $0 7 $291,230 0 $0 APPLICATIONS DENIED 0 $0 63 $335,732 253 $268,044 72 $93,793 0 $0 8 $305,451 1 $5,000 APPLICATIONS WITHDRAWN 0 $0 41 $312,401 282 $238,364 32 $139,119 0 $0 8 $300,250 0 $0 FILES CLOSED FOR INCOMPLETENESS 0 $0 13 $232,215 120 $279,379 11 $88,434 1 $100,000 3 $132,827 0 $0
Aggregated Statistics For Year 2003(Based on 9 full and 1 partial tracts) A) FHA, FSA/RHS & VA B) Conventional C) Refinancings D) Home Improvement Loans F) Non-occupant Loans on Number Average Value Number Average Value Number Average Value Number Average Value Number Average Value
LOANS ORIGINATED 7 $260,356 415 $288,344 2,063 $206,177 80 $58,064 21 $227,797 APPLICATIONS APPROVED, NOT ACCEPTED 0 $0 55 $306,974 336 $207,764 42 $57,101 6 $183,613 APPLICATIONS DENIED 0 $0 50 $329,654 434 $236,017 49 $45,271 6 $254,333 APPLICATIONS WITHDRAWN 2 $247,000 28 $274,261 342 $212,379 13 $44,202 3 $265,333 FILES CLOSED FOR INCOMPLETENESS 0 $0 19 $298,287 89 $231,975 4 $85,000 0 $0
Aggregated Statistics For Year 2002(Based on 9 full and 1 partial tracts) A) FHA, FSA/RHS & VA B) Conventional C) Refinancings D) Home Improvement Loans E) Loans on Dwellings For 5+ Families F) Non-occupant Loans on Number Average Value Number Average Value Number Average Value Number Average Value Number Average Value Number Average Value
LOANS ORIGINATED 1 $94,000 410 $248,931 1,483 $184,909 180 $77,328 1 $9,250,000 14 $213,036 APPLICATIONS APPROVED, NOT ACCEPTED 1 $226,000 51 $234,269 211 $173,130 46 $42,241 0 $0 2 $142,180 APPLICATIONS DENIED 1 $113,280 32 $283,040 279 $197,408 62 $58,977 0 $0 2 $147,970 APPLICATIONS WITHDRAWN 0 $0 33 $254,145 290 $194,848 42 $71,596 0 $0 7 $130,429 FILES CLOSED FOR INCOMPLETENESS 0 $0 10 $256,599 98 $200,822 2 $28,650 0 $0 3 $325,667
Aggregated Statistics For Year 2001(Based on 9 full and 1 partial tracts) A) FHA, FSA/RHS & VA B) Conventional C) Refinancings D) Home Improvement Loans E) Loans on Dwellings For 5+ Families F) Non-occupant Loans on Number Average Value Number Average Value Number Average Value Number Average Value Number Average Value Number Average Value
LOANS ORIGINATED 11 $206,455 380 $218,454 1,023 $172,634 156 $66,942 0 $0 13 $130,923 APPLICATIONS APPROVED, NOT ACCEPTED 1 $241,000 45 $211,527 179 $140,289 61 $49,452 0 $0 2 $89,000 APPLICATIONS DENIED 0 $0 35 $234,573 251 $164,921 63 $43,561 0 $0 6 $173,847 APPLICATIONS WITHDRAWN 1 $275,010 29 $217,619 286 $155,582 39 $50,296 1 $166,510 2 $128,000 FILES CLOSED FOR INCOMPLETENESS 0 $0 9 $213,216 48 $173,203 12 $86,603 0 $0 0 $0
Aggregated Statistics For Year 2000(Based on 9 full and 1 partial tracts) A) FHA, FSA/RHS & VA B) Conventional C) Refinancings D) Home Improvement Loans E) Loans on Dwellings For 5+ Families F) Non-occupant Loans on Number Average Value Number Average Value Number Average Value Number Average Value Number Average Value Number Average Value
LOANS ORIGINATED 11 $203,635 400 $200,519 336 $120,061 160 $43,370 2 $667,500 12 $189,097 APPLICATIONS APPROVED, NOT ACCEPTED 1 $215,000 44 $200,639 78 $136,889 62 $46,532 0 $0 0 $0 APPLICATIONS DENIED 1 $207,000 49 $214,591 188 $139,291 67 $51,099 0 $0 4 $215,000 APPLICATIONS WITHDRAWN 3 $199,000 36 $270,500 199 $101,858 26 $44,330 1 $1,125,000 6 $62,500 FILES CLOSED FOR INCOMPLETENESS 0 $0 7 $236,714 32 $180,380 10 $44,865 0 $0 0 $0
Aggregated Statistics For Year 1999(Based on 9 full and 1 partial tracts) A) FHA, FSA/RHS & VA B) Conventional C) Refinancings D) Home Improvement Loans E) Loans on Dwellings For 5+ Families F) Non-occupant Loans on Number Average Value Number Average Value Number Average Value Number Average Value Number Average Value Number Average Value
LOANS ORIGINATED 16 $180,942 436 $179,802 602 $131,409 177 $40,118 0 $0 6 $129,247 APPLICATIONS APPROVED, NOT ACCEPTED 0 $0 40 $215,755 141 $124,284 36 $36,857 1 $4,950 3 $178,260 APPLICATIONS DENIED 3 $177,533 49 $214,038 200 $127,439 65 $42,141 1 $39,950 8 $178,401 APPLICATIONS WITHDRAWN 2 $189,560 29 $163,484 194 $113,065 41 $101,066 1 $204,750 4 $116,002 FILES CLOSED FOR INCOMPLETENESS 1 $152,480 10 $185,624 53 $145,157 10 $44,523 0 $0 3 $122,477
Detailed mortgage data for all 10 tracts in Commack, NY
Private Mortgage Insurance Companies Aggregated Statistics For Year 2009(Based on 9 full and 1 partial tracts) A) Conventional B) Refinancings Number Average Value Number Average Value
LOANS ORIGINATED 24 $370,600 16 $378,098 APPLICATIONS APPROVED, NOT ACCEPTED 13 $353,142 6 $390,645 APPLICATIONS DENIED 6 $400,167 7 $389,347 APPLICATIONS WITHDRAWN 0 $0 3 $428,333 FILES CLOSED FOR INCOMPLETENESS 1 $362,000 0 $0
Aggregated Statistics For Year 2008(Based on 9 full and 1 partial tracts) A) Conventional B) Refinancings Number Average Value Number Average Value
LOANS ORIGINATED 39 $398,732 6 $401,500 APPLICATIONS APPROVED, NOT ACCEPTED 8 $402,831 4 $393,640 APPLICATIONS DENIED 5 $394,600 1 $417,000 APPLICATIONS WITHDRAWN 2 $289,425 1 $417,000 FILES CLOSED FOR INCOMPLETENESS 0 $0 1 $390,000
Aggregated Statistics For Year 2007(Based on 8 full and 1 partial tracts) A) Conventional B) Refinancings C) Non-occupant Loans on Number Average Value Number Average Value Number Average Value
LOANS ORIGINATED 22 $397,939 4 $407,500 3 $356,333 APPLICATIONS APPROVED, NOT ACCEPTED 9 $403,556 1 $540,000 2 $310,000 APPLICATIONS DENIED 3 $437,333 0 $0 0 $0 APPLICATIONS WITHDRAWN 2 $414,000 1 $373,000 0 $0 FILES CLOSED FOR INCOMPLETENESS 0 $0 1 $460,000 0 $0
Aggregated Statistics For Year 2006(Based on 7 full and 1 partial tracts) A) Conventional B) Refinancings C) Non-occupant Loans on Number Average Value Number Average Value Number Average Value
LOANS ORIGINATED 11 $418,778 5 $403,746 1 $416,000 APPLICATIONS APPROVED, NOT ACCEPTED 5 $475,512 1 $638,040 0 $0 APPLICATIONS DENIED 1 $347,000 0 $0 0 $0 APPLICATIONS WITHDRAWN 0 $0 2 $368,250 0 $0 FILES CLOSED FOR INCOMPLETENESS 0 $0 0 $0 0 $0
Aggregated Statistics For Year 2005(Based on 5 full and 1 partial tracts) A) Conventional B) Refinancings C) Non-occupant Loans on Number Average Value Number Average Value Number Average Value
LOANS ORIGINATED 3 $339,000 2 $457,500 1 $243,000 APPLICATIONS APPROVED, NOT ACCEPTED 6 $441,000 2 $350,000 0 $0 APPLICATIONS DENIED 1 $380,780 0 $0 0 $0 APPLICATIONS WITHDRAWN 0 $0 0 $0 0 $0 FILES CLOSED FOR INCOMPLETENESS 0 $0 0 $0 0 $0
Aggregated Statistics For Year 2004(Based on 9 full and 1 partial tracts) A) Conventional B) Refinancings C) Non-occupant Loans on Number Average Value Number Average Value Number Average Value
LOANS ORIGINATED 16 $360,447 4 $338,755 2 $375,500 APPLICATIONS APPROVED, NOT ACCEPTED 8 $377,951 5 $353,200 0 $0 APPLICATIONS DENIED 0 $0 0 $0 0 $0 APPLICATIONS WITHDRAWN 3 $289,333 2 $208,790 0 $0 FILES CLOSED FOR INCOMPLETENESS 1 $323,000 0 $0 0 $0
Aggregated Statistics For Year 2003(Based on 9 full and 1 partial tracts) A) Conventional B) Refinancings C) Non-occupant Loans on Number Average Value Number Average Value Number Average Value
LOANS ORIGINATED 51 $339,767 9 $268,111 2 $263,500 APPLICATIONS APPROVED, NOT ACCEPTED 6 $328,500 1 $282,000 0 $0 APPLICATIONS DENIED 0 $0 0 $0 0 $0 APPLICATIONS WITHDRAWN 1 $301,000 1 $184,000 0 $0 FILES CLOSED FOR INCOMPLETENESS 0 $0 1 $303,000 0 $0
Aggregated Statistics For Year 2002(Based on 9 full and 1 partial tracts) A) Conventional B) Refinancings Number Average Value Number Average Value
LOANS ORIGINATED 42 $287,339 23 $316,806 APPLICATIONS APPROVED, NOT ACCEPTED 22 $320,805 7 $321,714 APPLICATIONS DENIED 0 $0 0 $0 APPLICATIONS WITHDRAWN 4 $258,000 1 $246,000 FILES CLOSED FOR INCOMPLETENESS 0 $0 0 $0
Aggregated Statistics For Year 2001(Based on 9 full and 1 partial tracts) A) Conventional B) Refinancings Number Average Value Number Average Value
LOANS ORIGINATED 64 $265,644 22 $250,085 APPLICATIONS APPROVED, NOT ACCEPTED 21 $258,476 11 $264,001 APPLICATIONS DENIED 1 $315,000 2 $228,430 APPLICATIONS WITHDRAWN 3 $248,000 1 $189,000 FILES CLOSED FOR INCOMPLETENESS 0 $0 0 $0
Aggregated Statistics For Year 2000(Based on 9 full and 1 partial tracts) A) Conventional B) Refinancings Number Average Value Number Average Value
LOANS ORIGINATED 60 $232,339 9 $236,737 APPLICATIONS APPROVED, NOT ACCEPTED 10 $238,395 4 $158,750 APPLICATIONS DENIED 0 $0 1 $428,000 APPLICATIONS WITHDRAWN 2 $214,000 0 $0 FILES CLOSED FOR INCOMPLETENESS 1 $187,000 0 $0
Aggregated Statistics For Year 1999(Based on 9 full and 1 partial tracts) A) Conventional B) Refinancings C) Non-occupant Loans on Number Average Value Number Average Value Number Average Value
LOANS ORIGINATED 122 $201,415 32 $189,211 1 $177,700 APPLICATIONS APPROVED, NOT ACCEPTED 10 $233,803 10 $169,505 0 $0 APPLICATIONS DENIED 8 $211,350 1 $153,000 0 $0 APPLICATIONS WITHDRAWN 2 $181,245 0 $0 0 $0 FILES CLOSED FOR INCOMPLETENESS 0 $0 0 $0 0 $0
Most common first names in Commack, NY among deceased individuals Name Count Lived (average)
John 228 73.0 years Joseph 175 74.3 years Mary 149 79.1 years William 124 73.6 years Anna 116 85.4 years Rose 102 84.2 years Frank 100 75.3 years Helen 93 79.9 years Margaret 93 79.4 years Robert 91 65.2 years
Most common last names in Commack, NY among deceased individuals Last name Count Lived (average)
Cohen 40 84.1 years Schwartz 18 86.5 years Smith 18 75.3 years Friedman 17 84.7 years Goldstein 16 83.6 years Miller 16 77.8 years Johnson 15 73.7 years Kaplan 14 84.4 years Murphy 14 77.3 years Katz 14 81.5 years
Commack compared to New York state average:
Median household income above state average. Median house value above state average. Unemployed percentage significantly below state average. Black race population percentage significantly below state average. Hispanic race population percentage below state average. Foreign-born population percentage below state average. Renting percentage significantly below state average. Length of stay since moving in above state average. Number of rooms per house significantly above state average. Percentage of population with a bachelor's degree or higher above state average.
#3 on the list of "Top 101 cities where residents moved in more then 10 years ago (10,000+ households)"
#69 on the list of "Top 101 cities with the most residents born in Other Southern Africa (population 500+)"
#3 on the list of "Top 101 counties with the most Catholic adherents"
#6 on the list of "Top 101 counties with the lowest percentage of residents relocating from other counties between 2010 and 2011"
#7 on the list of "Top 101 counties with the lowest surface withdrawal of fresh water for public supply (pop. 50,000+)"
#9 on the list of "Top 101 counties with the lowest percentage of residents relocating to other counties in 2011"
#19 on the list of "Top 101 counties with the highest ground withdrawal of fresh water for public supply (pop. 50,000+)"
Top Patent Applicants
Behrouz Aghili (57)
Mark Drzymala (40)
An-Hu Li (17)
Yun Mo (13)
Xin Chen (11)
James Carey (11)
Rory A. Koval (9)
Shao Hong Zhou (8)
Ranajoy Sarkar (6)
Anthony Faraci (5)
Total of 325 patent applications in 2008-2025.


 Recent articles from our blog. Our writers, many of them Ph.D. graduates or candidates, create easy-to-read articles on a wide variety of topics.
 (4.8 miles
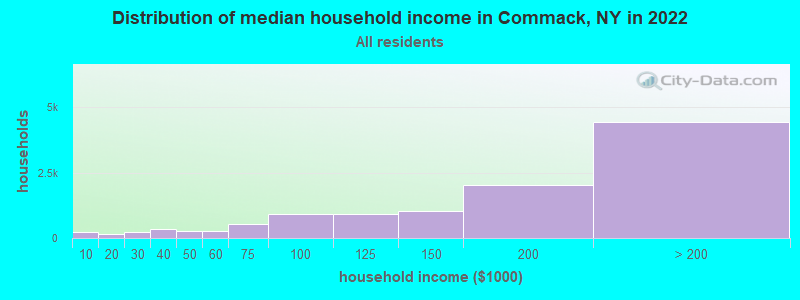
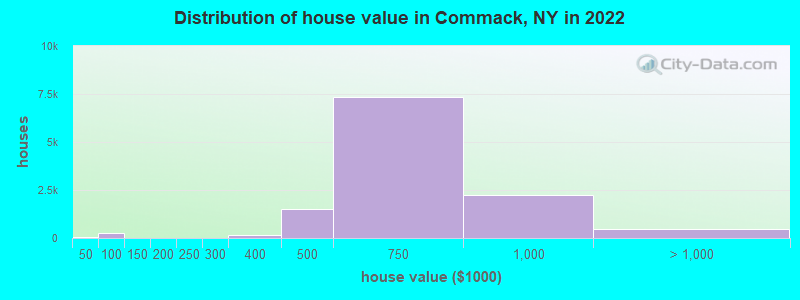
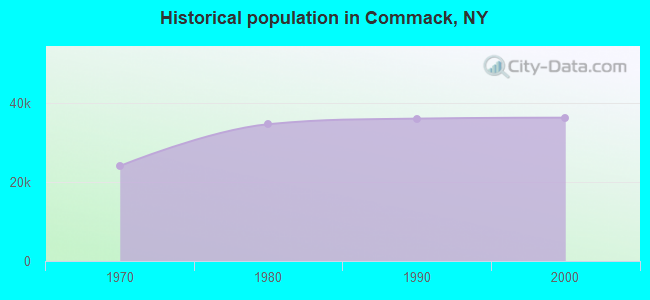
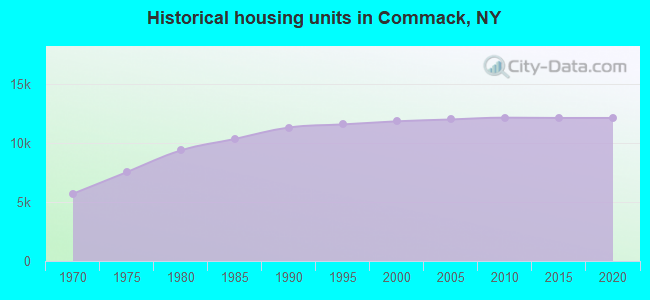


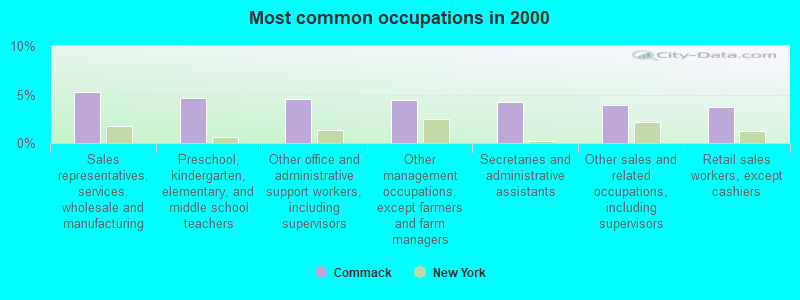
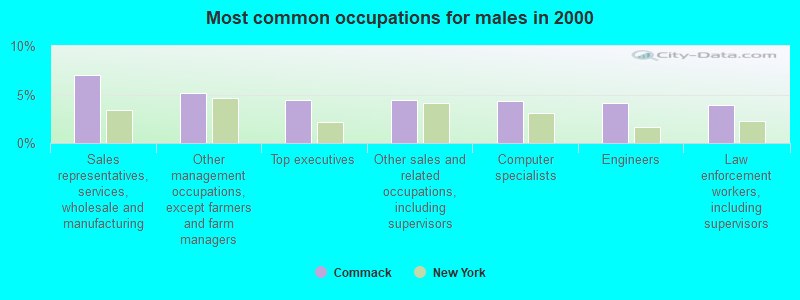
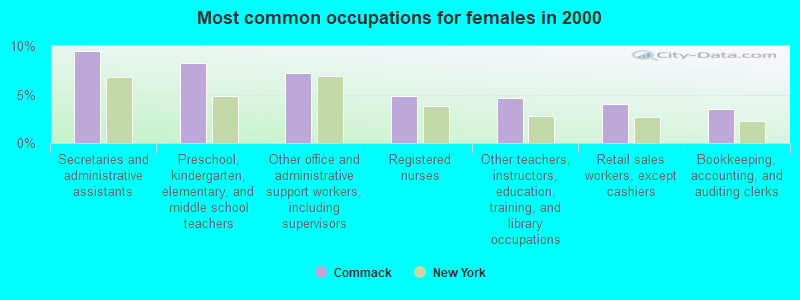


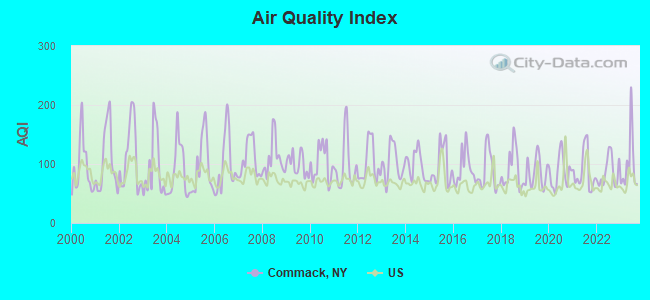
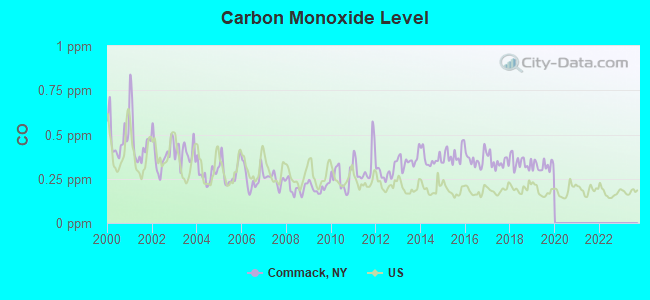
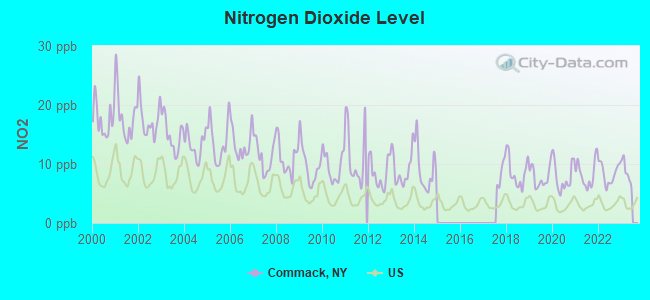
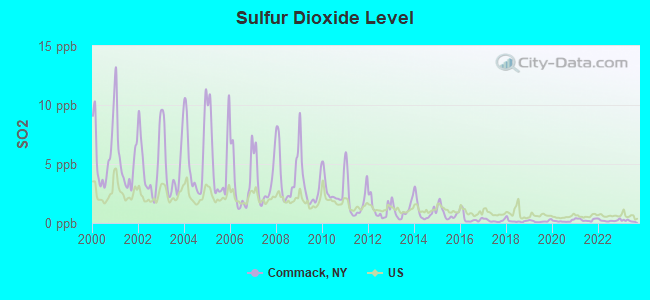
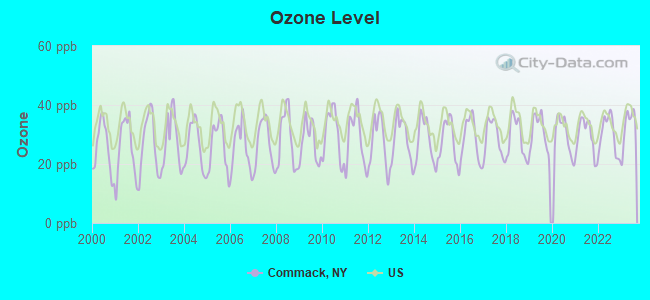
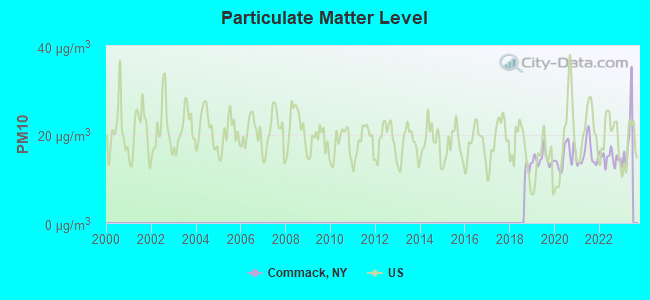
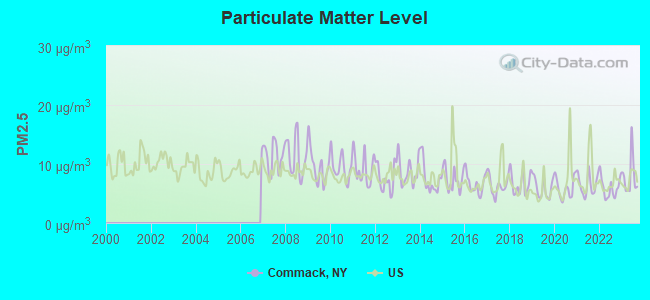

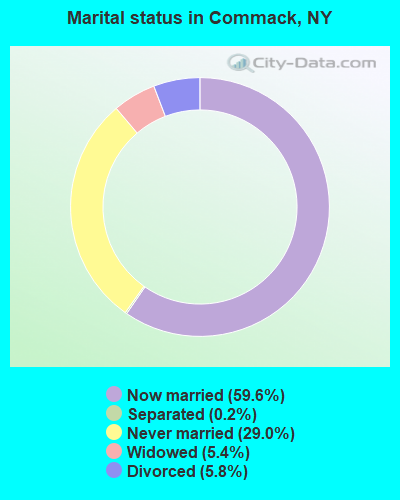
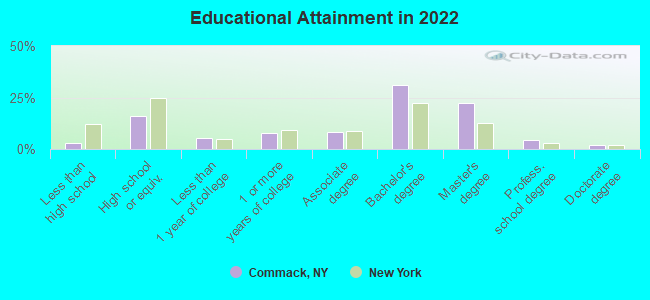
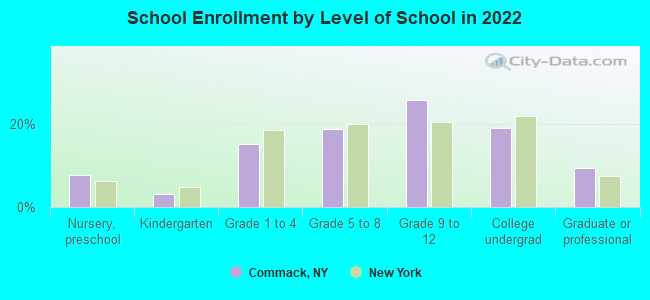
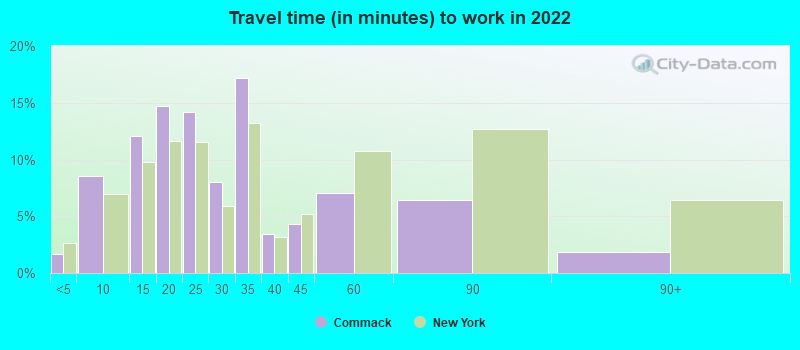
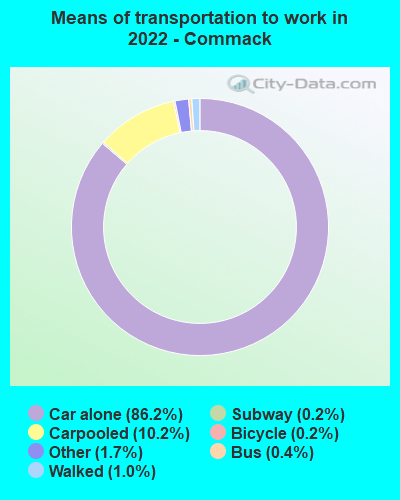


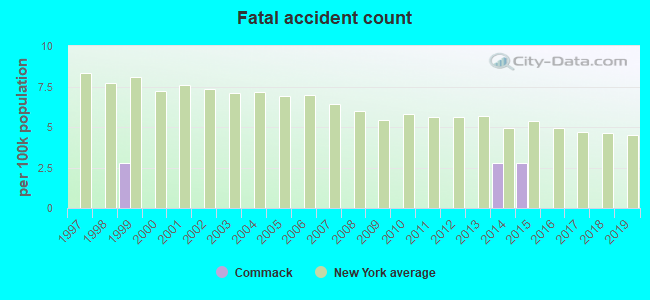
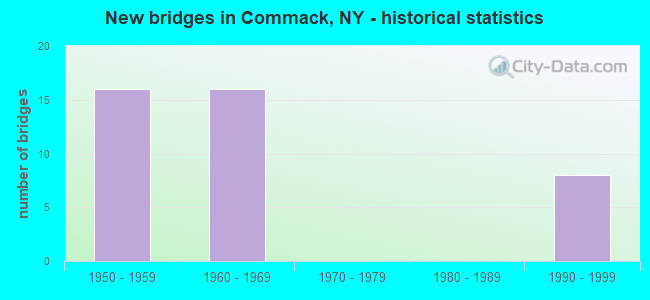
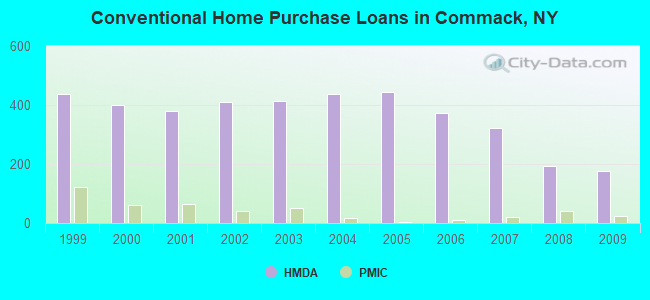
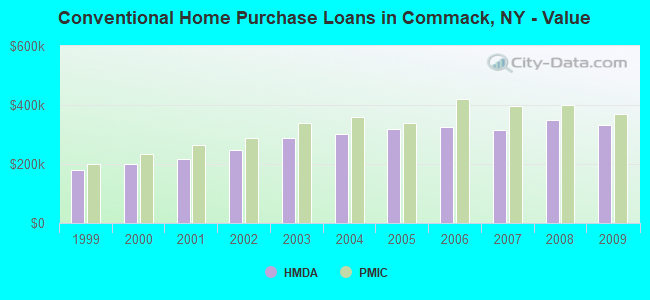
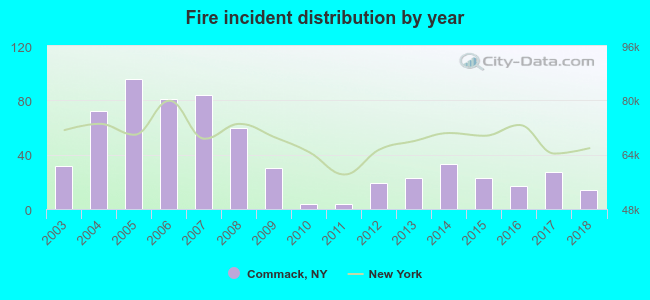 Based on the data from the years 2003 - 2018 the average number of fires per year is 39. The highest number of fire incidents - 96 took place in 2005, and the least - 4 in 2010. The data has a declining trend.
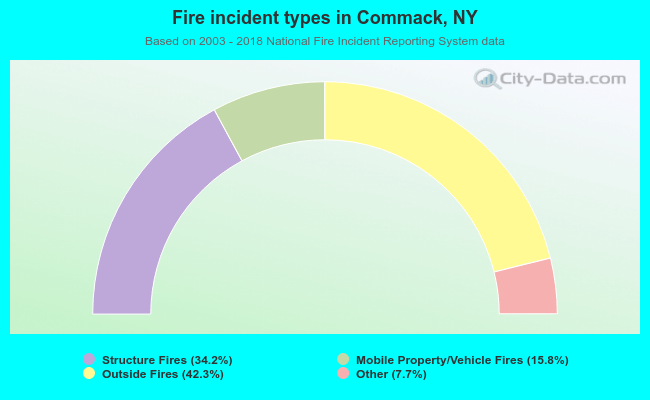 When looking into fire subcategories, the most reports belonged to: Outside Fires (42.3%), and Structure Fires (34.2%).